VSA: bullish and bearish volumes; signs of strength and weakness in the market. Anton Hanzenko.
The previous article described the concept of VSA analysis and how it is used in trading. Now let’s consider this topic in more detail, deepening the methodology of VSA analysis.
Bullish and bearish volumes
- Bullish volume – growth of volume on growing-candles and decrease on falling-candles.
- Bearish volume – an increase in volume on declining-candles and a decline in growing candles.
These concepts have already been encountered before, and received a detailed definition. However, in practice it is not so simple. First, the type of volume in the market is determined only after the candle is closed. And also it is worth remembering that in any candle there is both a bullish and a bearish volume in different ratios. Therefore, do not forget about smaller timeframes, where you can conduct a more in-depth analysis.
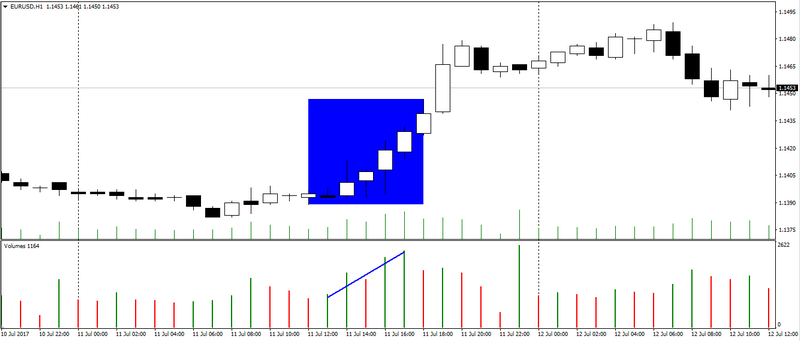
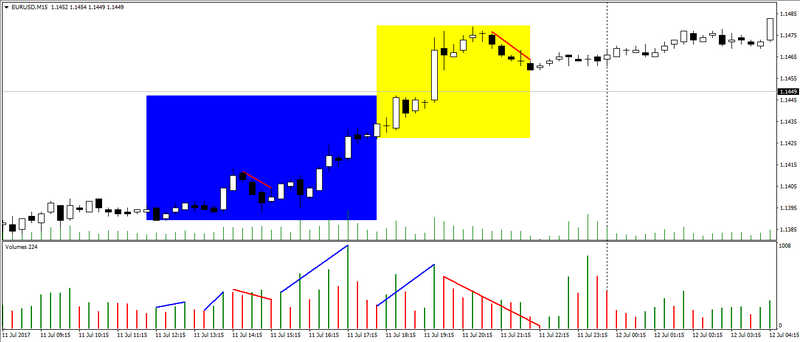
So the figure shows an example of a rapid upward trend, which corresponds to an almost ideal growth volume.
But if we go down from the timeframe H1 to M15, we will see a not so unambiguous picture.
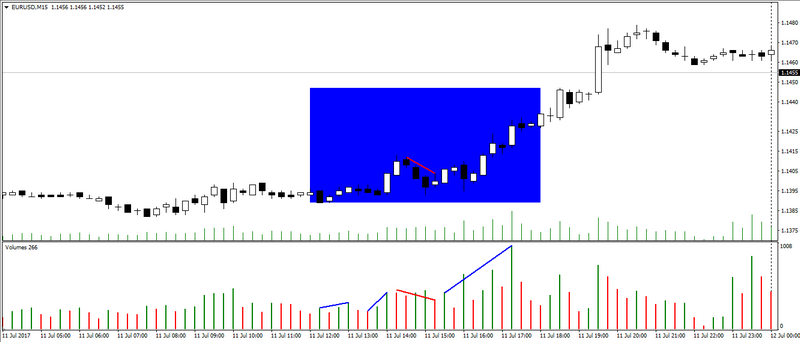
In some places it is clear that in the same uptrend with a bullish volume there is a bearish volume.
We return to the first figure of the second part of the uptrend (yellow zone).
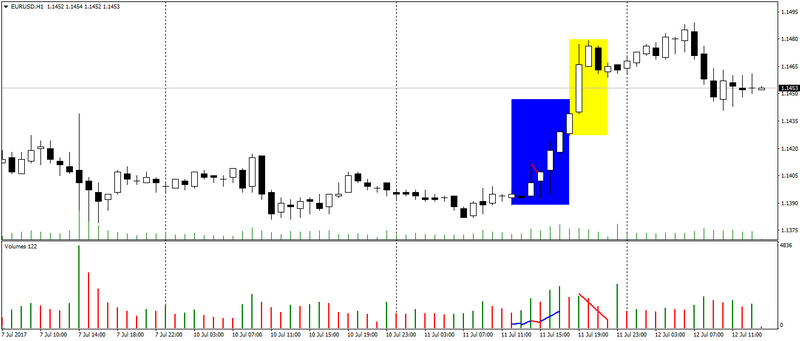
We see that after the update of the maximum, the volume on the market starts to decline, but the upward trend remains. This is explained by the fact that after the update of the maximum, market participants began to record profits, reducing this bullish volume.
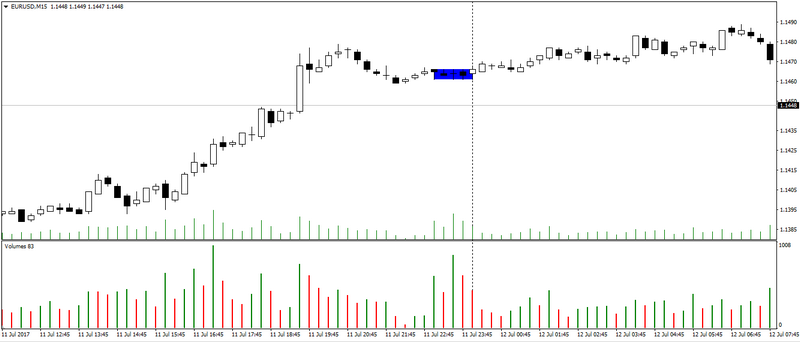
On M15, this movement can also be traced, on a smaller timeframe it looks like a bearish volume, but this is not the case, since an upward trend is maintained. A decrease in the end of the uptrend and the formation of lateral movement indicates the closure of long positions.
A low candle spread with a very high volume at the end of the day indicates a correction of positions and can often not be considered in analysis, since new volumes are beginning to be formed on the market with the start of new trades.
Signs of strength and weakness in the market
Signs of strength and weakness in the market respond to bullish and bearish sentiment in the market. And they correspond to certain patterns of bars that are characterized by:
- Down-bar or up-bar. Down-bar – closing is lower than closing of the previous bar. Up bar – closing is higher than the previous bar.
- The type of volume is characterized by: low, medium, high or very high.
- The candle spread is divided into: narrow, medium and high.
- Closing of the bar, which is divided into third: the top third of the bar, the middle third of the bar and the bottom third of the bar.
Patterns of weakness:
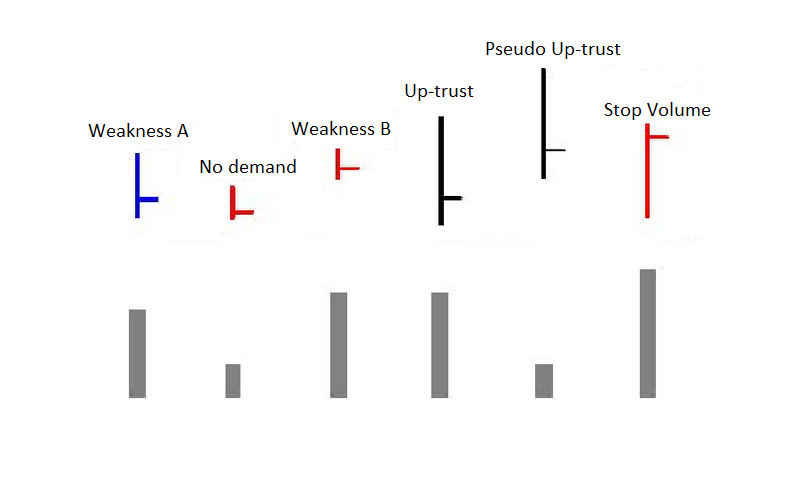
Weakness A
- down bar
- high volume
- medium or narrow spread
- closing in the lower third of the bar, or on the bottom third of the bar
No demand
- up bar
- low volume (first of all, you need to compare with the previous bar, it should be lower)
- narrow spread
- closing in the lower third or on the bottom third of the bar
- the first signs of weakness should have appeared on the background
- A good sign during a rollback on a downtrend
Weakness B
- up bar
- high or very high volume (the higher, the stronger the sign)
- narrow or very narrow spread
- closing in the lower third or in the middle third of the bar
- on the background there should be other signs of weakness, for certainty it is worth waiting for additional signs
Up-trust
- up bar or down bar
- this bar must update the local maximum and its maximum should not be redrawn
- spread high
- the closing should be in the lower third
- volume is high or very high
Pseudo Up-trust
- up bar or down bar
- as well as up-trust this bar should update the local maximum and its maximum should not be redrawn
- spread high
- closing in the lower third
- volume is low
- this attribute is less effective than the normal up-trust, therefore this feature requires confirmation
Stop Volume
- up bar
- broad spread
- very high volume
- need to wait for confirmation
Power patterns:
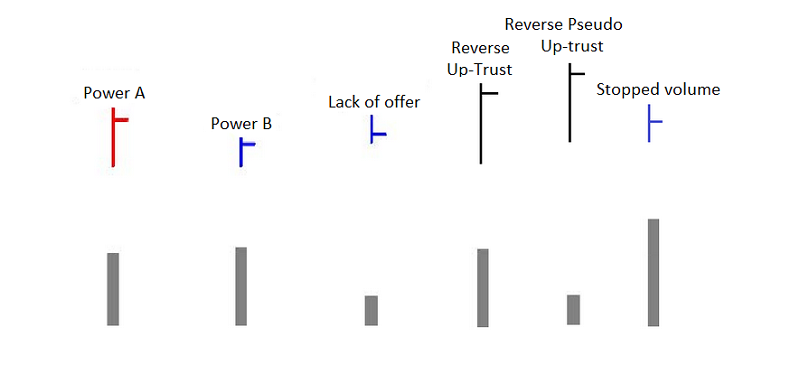
Power A
- up bar
- spread average
- medium or high volume
- closing in the upper third of the bar
Force B
- down bar
- narrow spread
- closing in the upper third
- high volume
- there must be other signs of strength
Lack of offer
- down bar
- narrow spread
- low volume
- closing in the lower third
- it is necessary to look for an additional signal of market strength
Reverse Up-Trust
- up bar or down bar (down-bar)
- this bar should update the local minimum and its minimum should not be redrawn
- spread high
- the closing should be in the upper third
- volume is high or very high
Pseudo Up-trust
- up bar or down bar (down-bar)
- as well as up-trust this bar should update the local minimum and its minimum should not be redrawn
- spread high
- closing in the upper third
- volume is low
- this feature is less effective than the normal reverse up-trust, therefore this feature requires confirmation
Stopped volume
- down bar
- spread narrow
- closing in the middle third of the bar
- volume is very high
- it is necessary to wait until the market strength is confirmed
Next time, we will consider the equally important sections of VSA analysis: a test of supply and demand, and the culmination of purchases and sales.
Anton Hanzenko