
VSA analysis – briefly about the main thing! Anton Hanzenko.
VSA (Volume Spread Analysis) is a method for analyzing trading volume in combination with the size of the candlestick and its general position. VSA analysis is a very voluminous course based on a technical analysis of the market and indicates the behavior of big money. Of course, all the nuances and subtleties of VSA analysis can not be put into one article, but it is quite possible to describe the basic principles and concepts.
Having deciphered the acronym VSA (Volume Spread Analysis) in detail, we understand that the analysis itself is based on the volume and spread, in this case the spread is not the difference between the ask and bid price, but the difference between the opening and closing points of the candlestck or its maximum and minimum.
What does VSA analysis do?
- Determination of the end of the trend
VSA analysis allows to determine the possible end points or trend reversal using the minimum set of indicators. The signal to the end of the analysis is a relatively low trading volume with a small spread of the candle after a certain trend.
So, we have some kind of trend that is moving in the corridor in the direction of the main movement and correction.
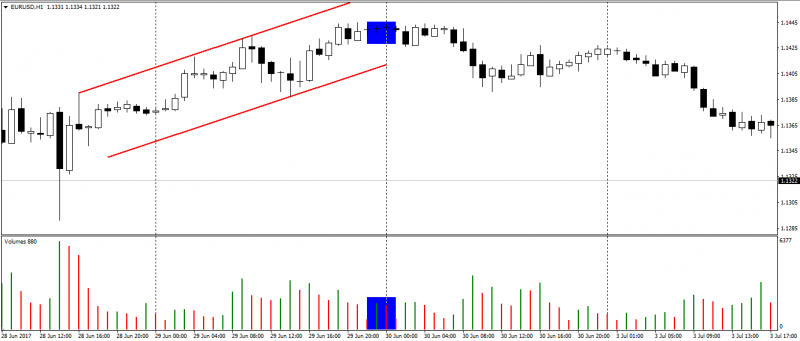
The figure shows an example of an uptrend, where growth and correction zones correspond to the trading volume. The signal to its end is the formation of a candlestick with a small spread and a very significant amount. It usually indicates the end or reversal of the trend. After all, the main volumes of trades that pushed prices left the market or changed direction.
- Determination of the strength and direction of the trend
In determining the strength of the trend, you need to know the following concepts:
- Bullish volume – volume growth on growing candlesticks and declining on declining candlesticks.
- Bearish volume – an increase in volume on declining candlesticks and a decrease on growing candlesticks.
Based on these definitions, it follows:
- for bullish volume – the upward market is determined by bearish candlesticks. It means that large players buy in the growing candlesticks, but they don’t sell in the falling candlesticks.
- for bearish volume – the downward market is determined by bullish candlesticks. It means that big players don’t buy in the growing candlesticks, but they sell in the falling candlesticks.
At first glance, the information seems confusing and incomprehensible, but after a short practice, everything becomes clear.
Disadvantage of VSA analysis
The main disadvantage is the lack of clear conditions for action, since the analysis is based on the relative volume of trades, because each specific situation requires an individual approach with an eye to the previous market dynamics.
Despite a significant drawback, VSA analysis can be an excellent complement to any trading strategy or form the basis of a profitable strategy for earning.
If you are interested in learning more about this topic – answer the question below and follow the Trader Blog!
Anton Hanzenko