
Technical analysis of gold and silver (Alexander Sivtsov)
Gold chart (current price: $ 1339.90)
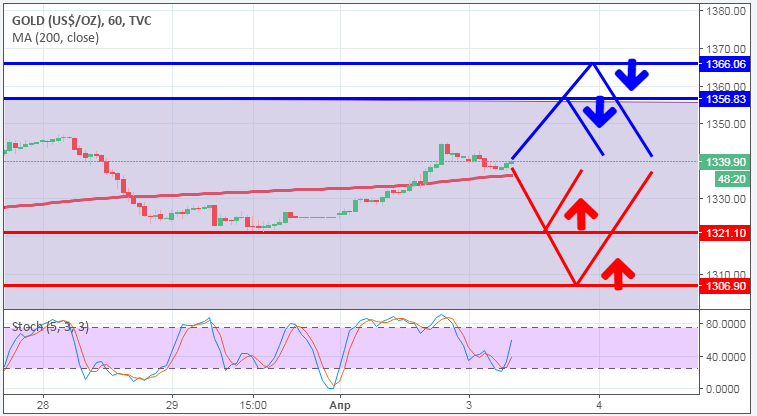
Gold is traded below the zero mark during the Asian session.
- Resistance 1: From $ 1356.83 (March 27 maximum)
- Resistance 2: From $ 1366.06 (January 25 maximum)
- Support 1: From $ 1321.10 (March 29 minimum)
- Support 2: From $ 1306.90 (March 20 minimum)
Computer analysis: The Stochastic Oscillator movings on the H4 chart indicate overbought of the instrument, against which there may be a decrease in the price of gold.
Silver chart (current price: $ 16,569)
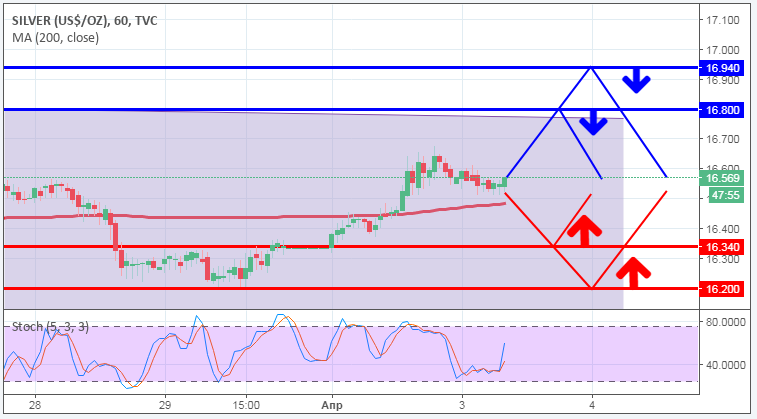
Silver is traded with a small minus during the Asian session.
- Resistance 1: From $ 16.80 (technical level)
- Resistance 2: From $ 16.94 (technical level)
- Support 1: From $ 16.34 (technical level)
- Support 2: From $ 16.20 (March 29 minimum)
Computer analysis: The Stochastic Oscillator movings on the chart H1 are in the neutral zone, against which the silver price may move in a narrow range.