
Тechnical analysis of currency pairs (Anton Hanzenko)
EUR USD (current price: 1.1920)
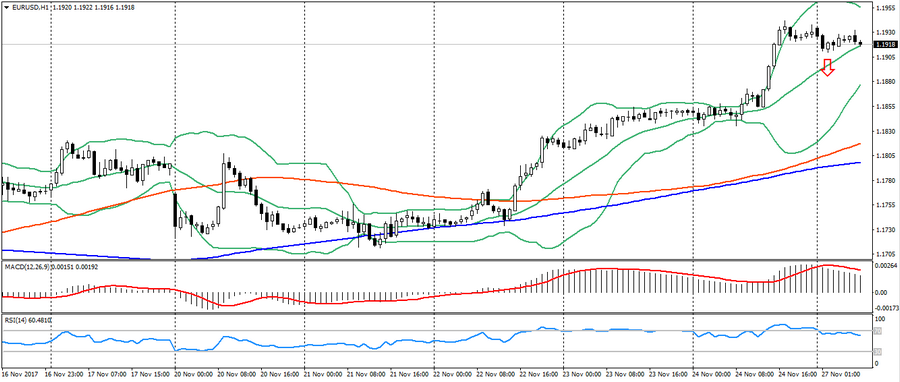
- Support levels: 1.1700 (August 2015 maximum), 1.1600 (2016 maximum), 1.1470.
- Levels of resistance: 1.2000, 1.2100, 1.2270 (November 2014 minimum).
- Computer analysis: MACD (signal – downward motion): the indicator is higher than 0, the signal line has left the body of the histogram. RSI is in the neutral zone. Bollinger Bands (period 20): neutral, declining volatility.
- The main recommendation: sale entry is started from 1.1850, 1.1880, 1.1900.
- Alternative recommendation: buy entry is started from 1.1880, 1.1840, 1.1800 (MA 200).
The euro-dollar is trading near a two-month high based on the overall decline in the US currency. In case of a significant overbought, one should expect a movement against Friday.
GBP USD (current price: 1.3320)
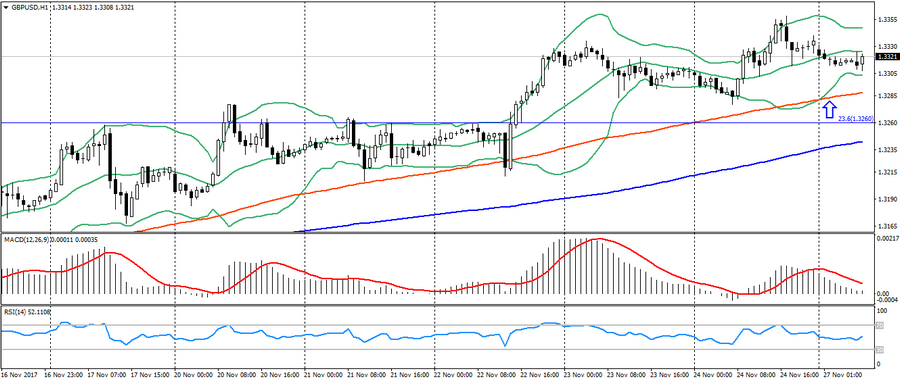
- Support levels: 1.3140, 1.2900, 1.2740 (August 2017 minimum).
- Resistance levels: 1.3500, 1.3660, 1.3830 (February 2016 minimum).
- Computer analysis: MACD (signal – downward motion): the indicator is higher than 0, the signal line has left the body of the histogram. RSI is in the neutral zone. Bollinger Bands (period 20): neutral, low volatility.
- The main recommendation: sale entry is started from 1.3360, 1.3380, 1.3400.
- Alternative recommendation: buy entry is started from 1.3290 (MA 100), 1.3260 (Fibo 23.6 from the January low), 1.3140 (MA 200).
The British pound weakened slightly at the beginning of the new week, but still maintains an upward trend.
USD CHF (current price: 0.9800)
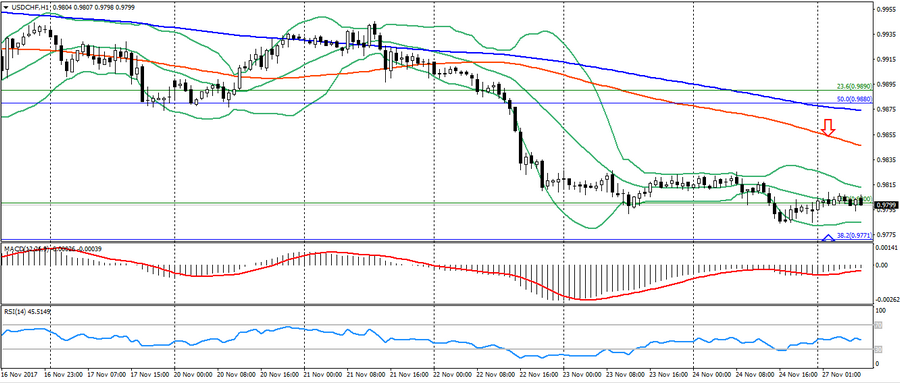
- Support levels: 0.9700, 0.9600, 0.9530.
- Resistance levels: 1.0000, 1.0050, 1.0100 (May maximum).
- Computer analysis: MACD (signal – upward motion): the indicator is below 0, the signal line has left the body of the histogram. RSI is in the neutral zone. Bollinger Bands (period 20): neutral, low volatility.
- The main recommendation: sale entry is started from 0.9820, 0.9850 (MA 100), 0.9880 (Fibo., 50.0 from the high of November 2016).
- Alternative recommendation: buy entry is started from 0.9780, 0.9770 (Fibo., 38.2 from the November 2016 high), 0.9740.
The Swiss franc is trading in a narrow flat with attempts to grow at risk.
USD JPY (current price: 111.30)
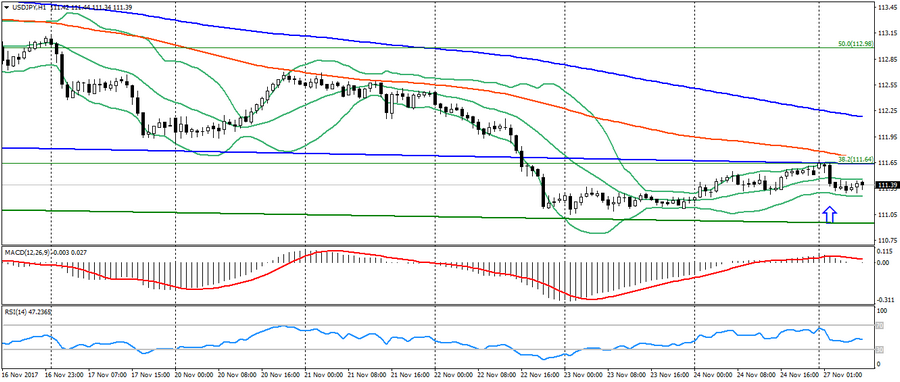
- Support levels: 108.90, 108.10 (April 2017 minimum), 107.30 (2017 minimum).
- Resistance levels: 113.70, 114.50 (July 2017 maximum), 115.00.
- Computer analysis: MACD (signal – downward motion): the indicator is higher than 0, the signal line has left the body of the histogram. RSI is in the neutral zone. Bollinger Bands (period 20): overbought, low volatility.
- The main recommendation: sale entry is started from 111.60 (Fibo., 38.2 from the maximum of December), 111.90, 112.20 (MA 200).
- Alternative recommendation: buy entry is started from 111.20, 110.90, 110.70.
The Japanese yen strengthened earlier in the day due to the maintainance of the risks, but the pair’s dynamics remains in the correction phase.
USD CAD (current price: 1.2710)
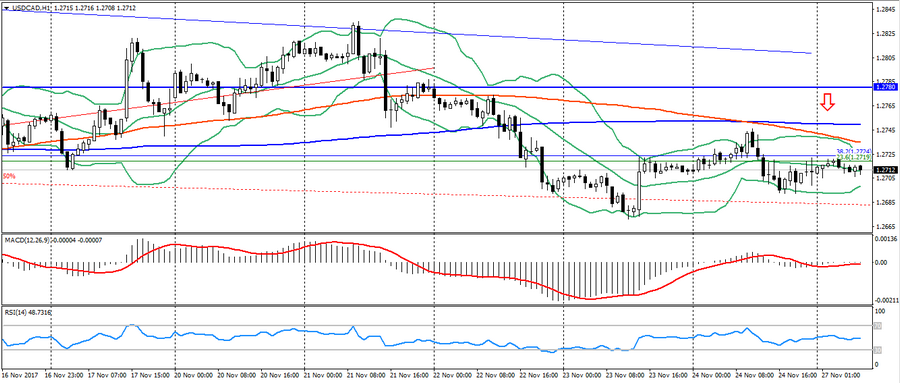
- Support levels: 1.2200, 1.2060 (2017 minimum), 1.1950 (2015 minimum).
- Resistance levels: 1.2780 (August 2017 maximum), 1.3000, 1.3160.
- Computer analysis: MACD (signal-flat): the indicator is near 0. RSI is in the neutral zone. Bollinger Bands (period 20): neutral, declining volatility.
- The main recommendation: sale entry is started from 1.2750 (MA 200), 1.2780, 1.2810.
- Alternative recommendation: buy entry is started from 1.2690, 1.2670, 1.2650.
The Canadian dollar remains near a month’s high due to the uncertainty of the American.
AUD USD (current price: 0.7610)
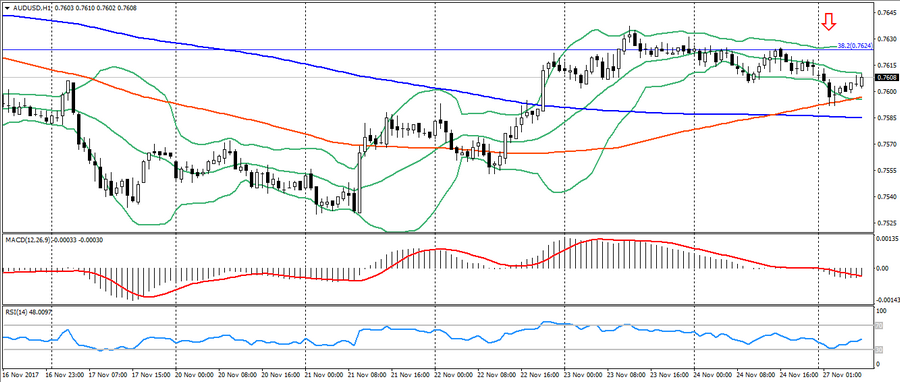
- Support levels: 0.7740, 0.7320 (2017 minimum), 0.7120.
- Resistance levels: 0.8120 (2017 maximum), 0.8200, 0.8290 (2014 maximum).
- Computer analysis: MACD (signal – downward motion): the indicator is below 0, the signal line is in the body of the histogram. RSI is in the neutral zone. Bollinger Bands (period 20): neutral, growing volatility.
- The main recommendation: sale entry is started from 0.7630 (Fibo, 38.2 from the low of January 2016), 0.7650, 0.7670.
- Alternative recommendation: buy entry is started from 0.7580 (MA 200), 0.7550, 0.7530.
The Australian was under slight pressure of correction, but the dynamics of the pair remains limited by a general downward trend.
NZD USD (current price: 0.6870)
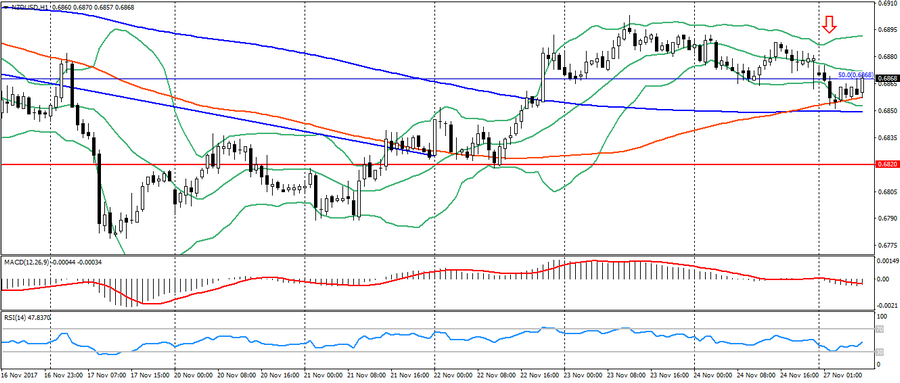
- Support levels: 0.7000, 0.6930, 0.6820 (the minimum of the current year).
- Resistance levels: 0.7380, 0.7450, 0.7550 (2017 maximum).
- Computer analysis: MACD (signal – downward motion): the indicator is below 0, the signal line is in the body of the histogram. RSI is in the neutral zone. Bollinger Bands (period 20): neutral, growing volatility.
- The main recommendation: sale entry is started from 0.6870 (Fibo, 50.0 low August 2016), 0.6890, 0.6910.
- Alternative recommendation: buy entry is started from 0.6850 (MA 200), 0.6820, 0.6790.
The New Zealand dollar remains under pressure of correction and a general downward trend for this pair.
XAU USD (current price: 1290.00)
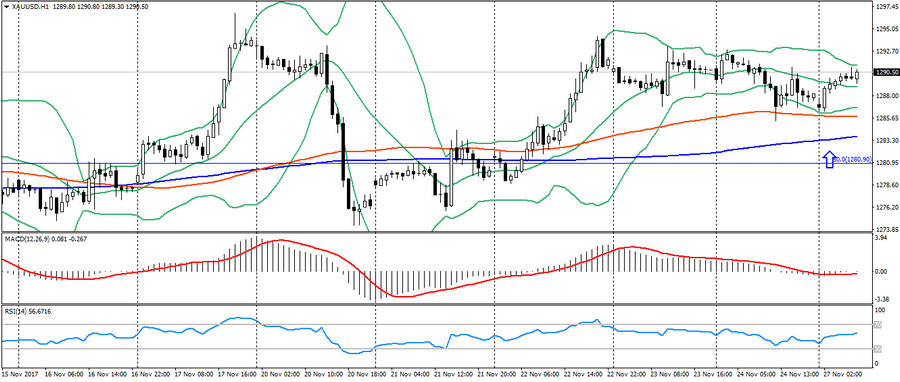
- Support levels: 1250.00, 1226.00, 1200.00.
- Resistance levels: 1340.00, 1355.00, 1374.00 (2016 maximum).
- Computer analysis: MACD (signal – downward motion): the indicator is higher than 0, the signal line has left the body of the histogram. RSI is in the neutral zone. Bollinger Bands (period 20): neutral, declining volatility.
- The main recommendation: sale entry is started from 1292.00, 1295.00, 1297.00.
- Alternative recommendation: buy entry is started from 1285.00 (MA 100), 1283.00 (MA 200), 1281.00 (Fibo., 50.0 from the July low).
Gold has strengthened a little earlier in the day due to the negative sentiment and the flight of investors from the risks.