
Тechnical analysis of currency pairs (Anton Hanzenko)
EUR USD (current price: 1.1770)
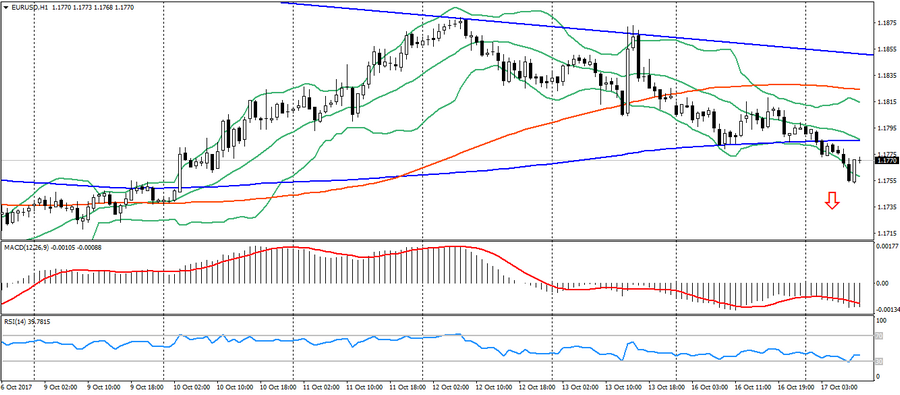
- Support levels: 1.1700 (the maximum of August 2015), 1.1600 (the maximum of 2016), 1.1470.
- Resistance levels: 1.2000, 1.2100, 1.2270 (the minimum of November 2014).
- Computer analysis: MACD (signal – downward motion): the indicator is below 0, the signal line in the body of the histogram. RSI in the neutral zone. Bollinger Bands (period 20): oversold, growing volatility.
- The main recommendation: sale entry is from 1.1810, 1.1830 (MA 100), 1.1880 (last week’s high).
- Alternative recommendation: buy entry is from 1.1750, 1.1730 (MA 100 to D1), 1.1700.
The euro remains under pressure of the American and political risks in the euro area. The dynamics of the pair remains limited to the existing downtrend, which indicates the possibility of further decline. News on the euro area and the USA is expected.
GBP USD (current price: 1.3260)
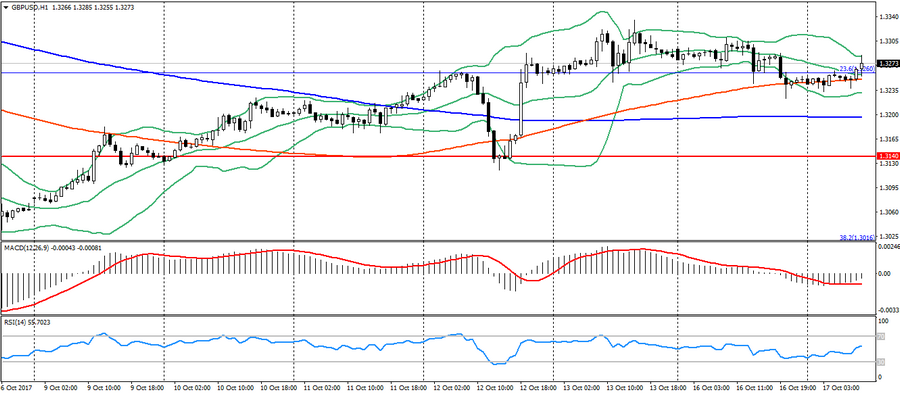
- Support levels: 1.3140, 1.2900, 1.2740 (the minimum of August 2017).
- Resistance levels: 1.3500, 1.3660, 1.3830 (the minimum of February 2016).
- Computer analysis: MACD (signal – upward motion): the indicator is below 0, the signal line has left the body of the histogram. RSI in the neutral zone. Bollinger Bands (period 20): neutral, low volatility.
- The main recommendation: sale entry is from 1.3300, 1.3340, 1.3380 (opening of October).
- Alternative recommendation: buy entry is from 1.3190 (MA 200), 1.3170, 1.3140.
The British pound is trading at the day opening, remaining under pressure from weak data in the UK. The pair continues to trade in the sideways trend, remaining near the level of 1.3260 (FIBO. 2.23.2 from the minimum of the current year). News on the euro area and the USA is expected.
USD CHF (current price: 0.9770)
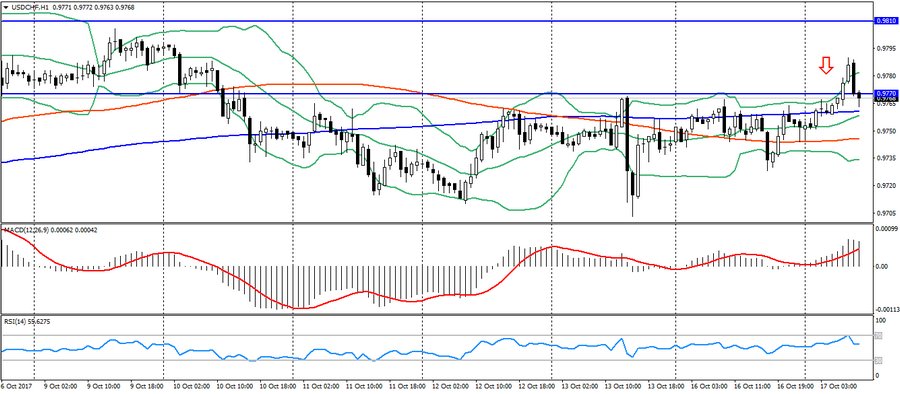
- Support levels: 0.9530, 0.9440 (the minimum of July 2017), 0.9420 (the minimum of September 2017).
- Resistance levels: 0.9770 (the maximum of August 2017), 0.9810, 0.9850.
- Computer analysis: MACD (signal – upward motion): indicator above 0, signal line in the body of the histogram. RSI in the neutral zone. Bollinger Bands (period 20): neutral, growing volatility.
- The main recommendation: sale entry is from 0.9790, 0.9810, 0.9830 (maximum of the last two months).
- Alternative recommendation: buy entry is from 0.9760 (MA 200), 0.9740 (MA 100), 0.9720.
The Swiss franc slightly strengthened on the negative start of European stock indices. Frank continues to maintain negative dynamics, but is limited to correction. News on the euro area and the USA is expected.
USD JPY (current price: 112.10)
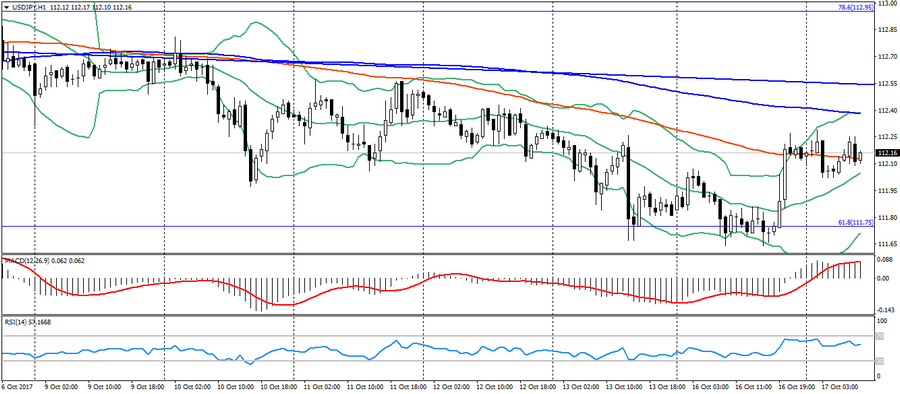
- Support levels: 108.90, 108.10 (minimum of the April 2017), 107.30 (minimum of the 2017).
- Resistance levels: 113.70, 114.50 (maximum of the July 2017), 115.00.
- Computer analysis: MACD (signal – upward motion): indicator above 0, signal line in the body of the histogram. RSI in the neutral zone. Bollinger Bands (period 20): neutral, declining volatility.
- The main recommendation: sale entry is from 112.40 (MA 200), 112.50, 112.70.
- Alternative recommendation: buy entry is from 111.90, 111.70 (FIBO 61.8 from the July’s high), 111.10 (MA 100 on D1).
The Japanese yen remains trading in a sideways trend near significant resistance levels. News on the USA is expected.
USD CAD (current price: 1.2530)
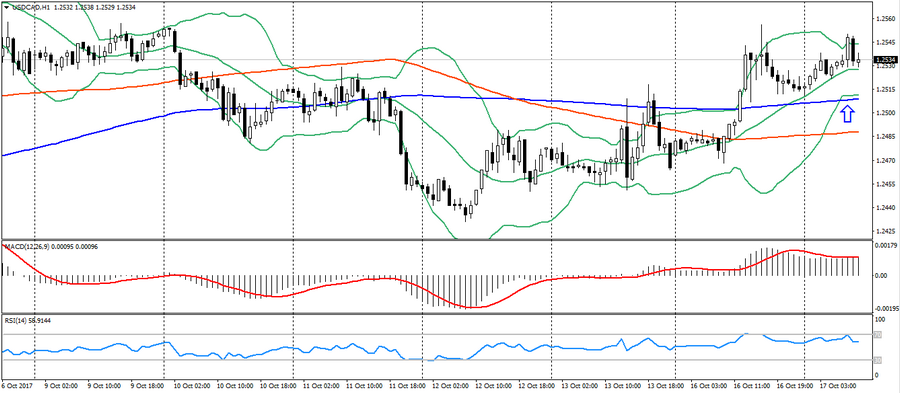
- Support levels: 1.2200, 1.2060 (minimum of the 2017), 1.1950 (minimum of the 2015).
- Resistance levels: 1.2780 (maximum of the August 2017), 1.3000, 1.3160.
- Computer analysis: MACD (signal – upward motion): indicator above 0, signal line in the body of the histogram. RSI in the neutral zone. Bollinger Bands (period 20): neutral, low volatility.
- The main recommendation: sale entry is from 1.2550, 1.2570 (the upper limit of the descending channel), 1.2600.
- Alternative recommendation: buy entry is from 1.2510 (MA 200), 1.2480 (MA 100), 1.2460.
The Canadian dollar remains to trade with a decrease on the growth of the American, but the upward dynamics of the pair is limited by the existing downward trend. For today, news on the USA is expected.
AUD USD (current price: 0.7850)
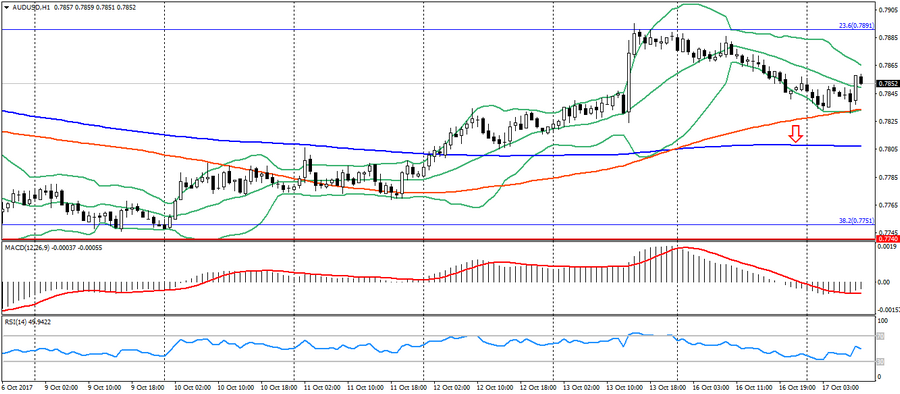
- Support levels: 0.7740, 0.7320 (minimum of the 2017), 0.7120.
- Resistance levels: 0.8120 (maximum of the 2017), 0.8200, 0.8290 (maximum of the 2014).
- Computer analysis: MACD (signal – upward motion): the indicator is below 0, the signal line has left the body of the histogram. RSI in the neutral zone. Bollinger Bands (period 20): neutral, declining volatility.
- The main recommendation: sale entry is from 0.7870, 0.7890 (Fibo, 23.6 from the minimum of December last year), 0.7920 (MA 200 per H4).
- Alternative recommendation: buy entry is from 0.7830 (MA 100), 0.7810 (MA 200), 0.7780.
The Australian dollar remains trading in a short-term uptrend, but is limited to the level of 0.7890-0.8000 (Fibo.2.6 from the minimum of November last year), which may cause a trend reversal. For today, news on the USA is expected.
NZD USD (current price: 0.7180)
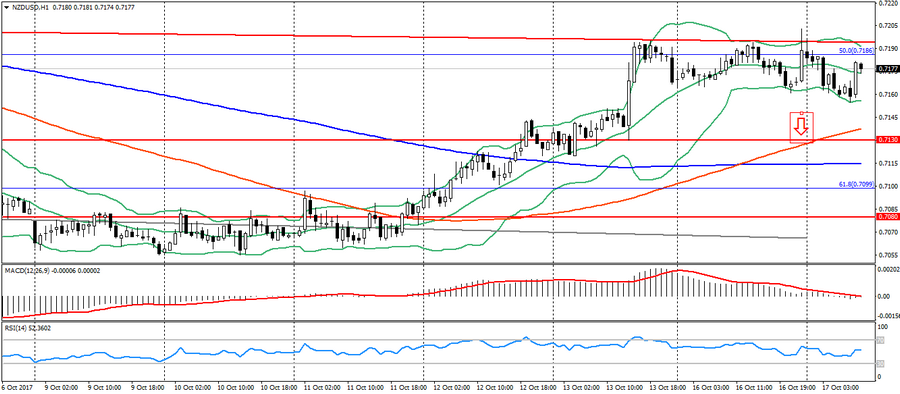
- Support levels: 0.7130 (the minimum of August 2017), 0.7080, 0.7000.
- Resistance levels: 0.7450, 0.7550 (maximum of the 2017), 0.7690.
- Computer analysis: MACD (signal-flat): indicator is near 0. RSI in the neutral zone. Bollinger Bands (period 20): neutral, declining volatility.
- The main recommendation: sale entry is from 0.7190 (Fibo, 50.0 from the May’s low), 0.7210 (MA 200 per H4), 0.7240.
- Alternative recommendation: buy entry is from 0.7130 (MA 100), 0.7110 (MA 200), 0.7100.
The New Zealand dollar is traded ambiguously after the data on New Zealand. Level 0.7180-90 remains an important resistance, a trend reversal is possible. For today, news on the USA is expected.
XAU USD (current price: 1289.00)
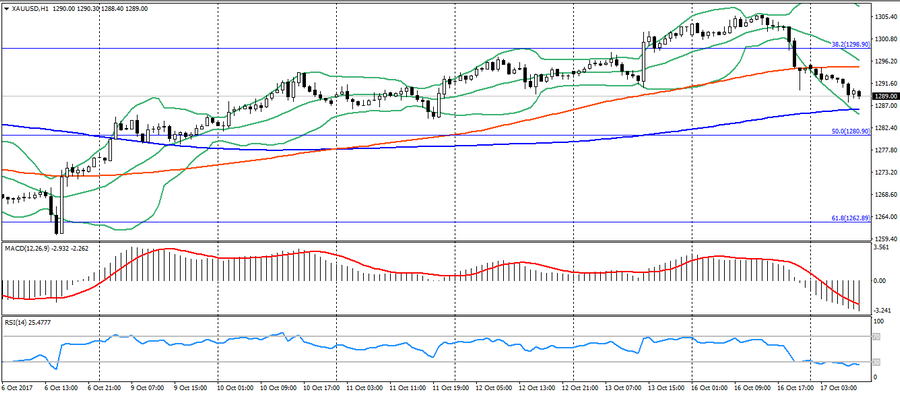
- Support levels: 1250.00, 1226.00, 1200.00.
- Resistance levels: 1340.00, 1355.00, 1374.00 (2016 maximum).
- Computer analysis: MACD (signal – downward motion): the indicator is below 0, the signal line in the body of the histogram. RSI in the oversold zone. Bollinger Bands (period 20): neutral, declining volatility.
- The main recommendation: sale entry is from 1296.00, 1298.00 (Fibo, 38.2 from the July’s low), 1305.00 (MA 200 per H4).
- Alternative recommendation: buy entry is from 1286.00 (MA 2100), 1281.00 (Fibo. 50.0 from the July’s low), 1276.00.
Gold slowed growth significantly , being under pressure of correction.