
Тechnical analysis of currency pairs (Anton Hanzenko)
EUR USD (current price: 1.1840)
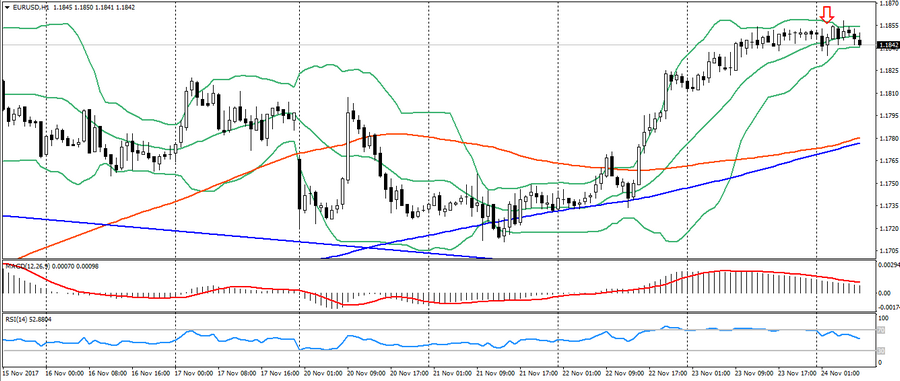
- Support levels: 1.1700 (August 2015 maximum), 1.1600 (2016 maximum), 1.1470.
- Resistance levels: 1.2000, 1.2100, 1.2270 (November 2014 minimum).
- Computer analysis: MACD (signal – downward motion): the indicator is higher than 0, the signal line has left the body of the histogram. RSI is in the neutral zone. Bollinger Bands (period 20): neutral, low volatility.
- The main recommendation: sale entry is started from 1.1840, 1.1860, 1.1900.
- Alternative recommendation: buy entry is started from 1.1810, 1.1780 (MA 800), 1.1750.
The euro is trading near a two-month high on the overall decline in the US currency due to rising fears of inflation in the US. Given the considerable overbought of the pair, one should expect a correction.
GBP USD (current price: 1.3300)
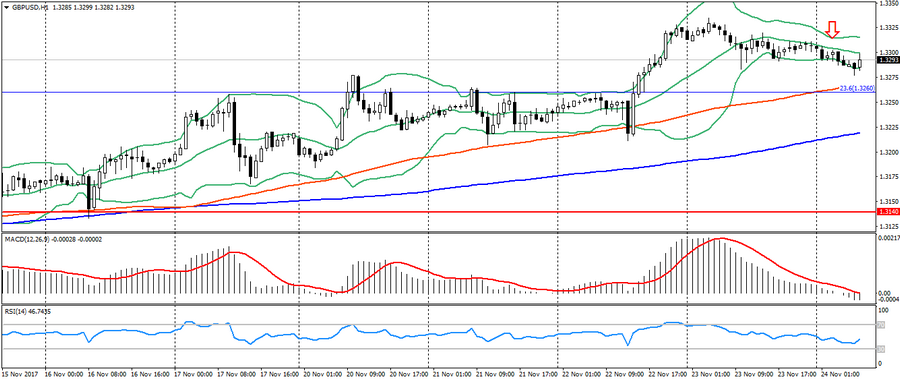
- Support levels: 1.3140, 1.2900, 1.2740 (August 2017 minimum).
- Resistance levels: 1.3500, 1.3660, 1.3830 (February 2016 minimum).
- Computer analysis: MACD (signal – downward motion): the indicator is below 0, the signal line is in the body of the histogram. RSI is in the neutral zone. Bollinger Bands (period 20): neutral, low volatility.
- The main recommendation: sale entry is started from 1.3300, 1.3330, 1.3360.
- Alternative recommendation: buy entry is started from 1.3260 (Fibo, 23.6 from the January low), 1.3200 (MA 200), 1.3140.
The British pound remains in the correction phase, confirming the safety of the monthly sideways trend.
USD CHF (current price: 0.9820)
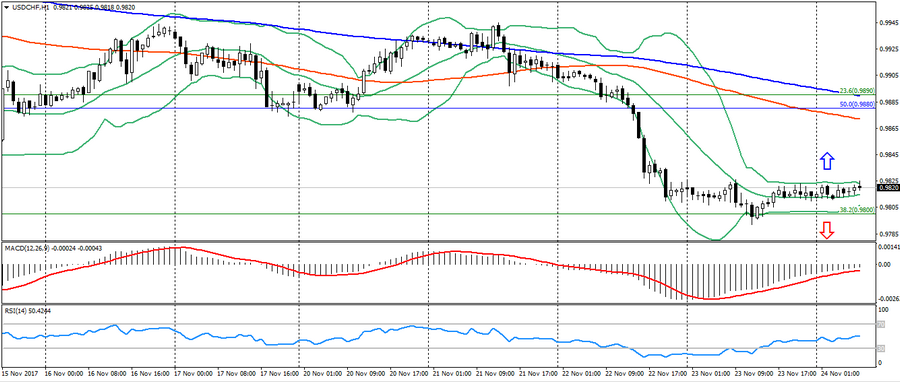
- Support levels: 0.9700, 0.9600, 0.9530.
- Resistance levels: 1.0000, 1.0050, 1.0100 (May maximum).
- Computer analysis: MACD (signal – upward motion): the indicator is below 0, the signal line has left the body of the histogram. RSI is in the neutral zone. Bollinger Bands (period 20): neutral, low volatility.
- The main recommendation: sale entry is started from 0.9840, 0.9860, 0.9880 (Fibo.50.0 from the high of November 2016).
- Alternative recommendation: buy entry is started from 0.9800, 0.9770 (Fibo, 38.2 from the high of November 2016), 0.9740.
The Swiss franc is trading in a narrow flat due to the low market activity.
USD JPY (current price: 111.50)
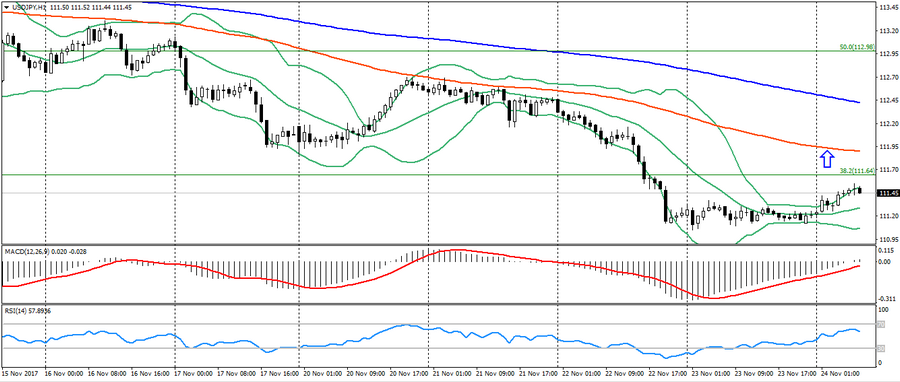
- Support levels: 108.90, 108.10 (April 2017 minimum), 107.30 (2017 minimum).
- Resistance levels: 113.70, 114.50 (July 2017 maximum), 115.00.
- Computer analysis: MACD (signal – upward motion): the indicator is below 0, the signal line has left the body of the histogram. RSI is in the neutral oversold zone. Bollinger Bands (period 20): overbought, growing volatility.
- The main recommendation: sale entry is started from 111.60 (Fibo. 38.2 from the maximum of December), 111.90 (MA 100), 112.50 (MA 200).
- Alternative recommendation: buy entry is started from 111.30, 111.10, 110.80.
The Japanese yen weakened slightly early in the day on attempts to increase Asia’s stock indices, but the pair’s dynamics is descending.
USD CAD (current price: 1.2730)
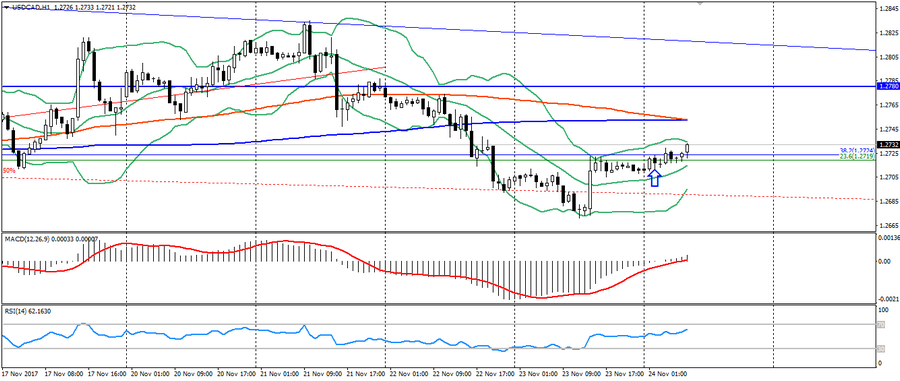
- Support levels: 1.2200, 1.2060 (2017 minimum), 1.1950 (2015 minimum).
- Resistance levels: 1.2780 (August 2017 maximum), 1.3000, 1.3160.
- Computer analysis: MACD (signal – upward motion): the indicator is above 0, the signal line is in the body of the histogram. RSI is in the neutral zone. Bollinger Bands (period 20): neutral, declining volatility.
- The main recommendation: sale entry is started from 1.2740 (Fibo, 23.6 September low), 1.2760 (MA 200), 1.2780.
- Alternative recommendation: buy entry is started from 1.2700 (MA 200 per H4), 1.2680, 1.2650.
The Canadian dollar maintains a negative attitude, caused by negative statistics on Canada.
AUD USD (current price: 0.7610)
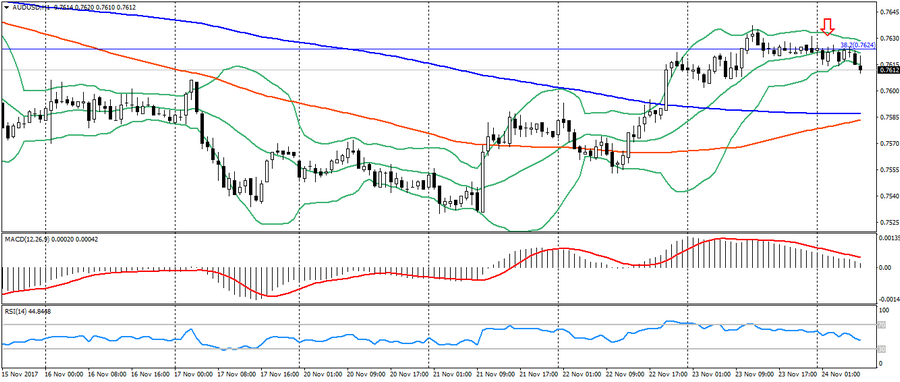
- Support levels: 0.7740, 0.7320 (2017 minimum), 0.7120.
- Resistance levels: 0.8120 (2017 maximum), 0.8200, 0.8290 (2014 maximum).
- Computer analysis: MACD (signal – downward motion): the indicator is higher than 0, the signal line has left the body of the histogram. RSI is in the neutral zone. Bollinger Bands (period 20): neutral, low volatility.
- The main recommendation: sale entry is started from 0.7630 (Fibo, 38.2 from the low of January 2016), 0.7650, 0.7670.
- Alternative recommendation: sale entry is started from of 0.7600, 0.7580 (MA 200), 0.7560.
The Australian also found itself under pressure of correction, but the pair’s dynamics remains limited due to the low market activity.
NZD USD (current price: 0.6870)
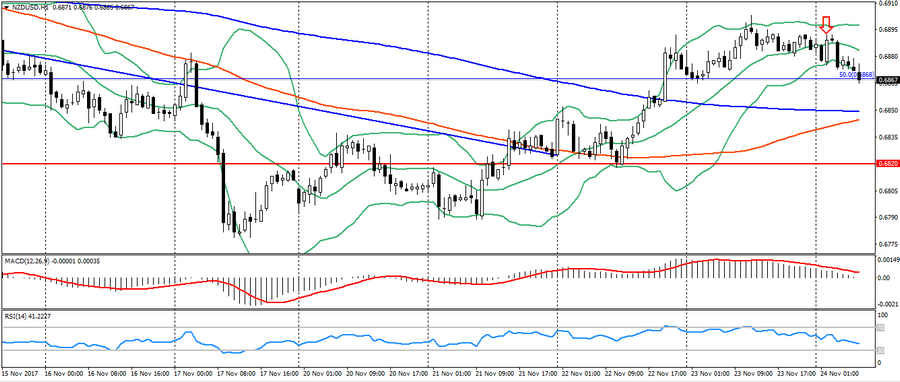
- Support levels: 0.7000, 0.6930, 0.6820 (the minimum of the current year).
- Resistance levels: 0.7380, 0.7450, 0.7550 (2017 maximum).
- Computer analysis: MACD (signal – downward motion): the indicator is higher than 0, the signal line has left the body of the histogram. RSI is in the neutral zone. Bollinger Bands (period 20): oversold, growing volatility.
- The main recommendation: sale entry is started from 0.6880, 0.6900, 0.6930.
- Alternative recommendation: buy entry is started from 0.6850 (MA 200), 0.6820, 0.6790.
The New Zealand dollar remains under pressure of correction and weak data on the trade balance of New Zealand.
XAU USD (current price: 1290.00)
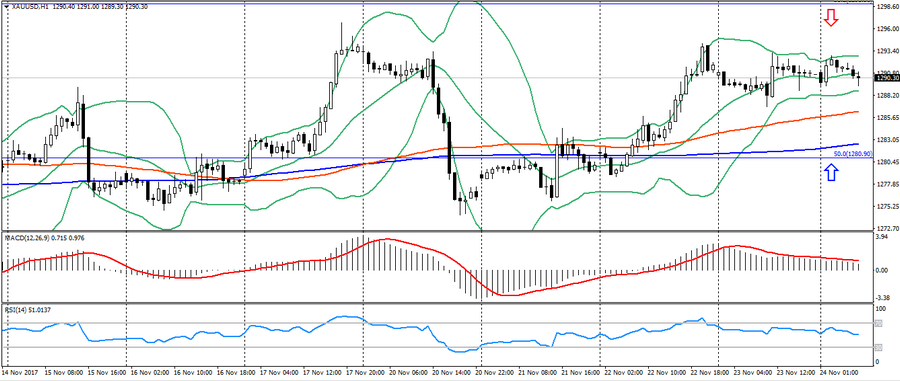
- Support levels: 1250.00, 1226.00, 1200.00.
- Resistance levels: 1340.00, 1355.00, 1374.00 (2016 maximum).
- Computer analysis: MACD (signal – downward motion): the indicator is higher than 0, the signal line has left the body of the histogram. RSI is in the neutral zone. Bollinger Bands (period 20): neutral, declining volatility.
- The main recommendation: sale entry is started from 1292.00, 1295.00, 1297.00.
- Alternative recommendation: buy entry is started from 1286.00 (MA 100), 1281.00 (Fibo., 50.0 from the low of July), 1277.00.
Gold weakened slightly at the beginning of the day, but still maintains a restrained-ascending trend.