
Data on the new home sales in the US
- New home sales (m/m) (Apr), fact -6.9%, forecast -2.8%.
- New home sales (Apr), fact 673K, forecast 675K.
New home sales in April slowed down after a significant increase earlier. Also worth noting is the revised data for April upward. Despite the slowdown, the overall dynamics of the indicator remains very positive.
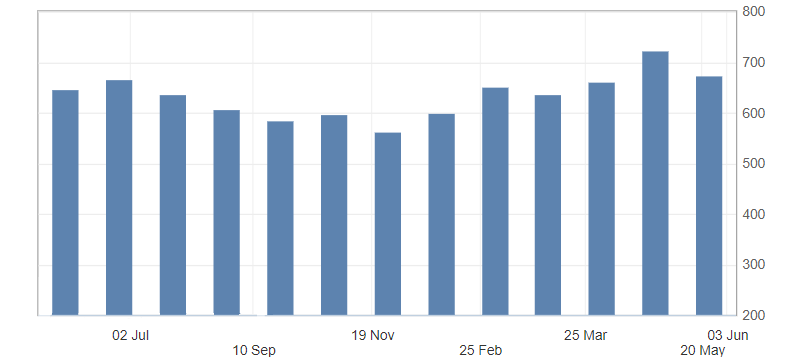
Fig. 1. New home sales chart in the US
Against the background of the lack of justification for forecasts for sales of new housing and the overall overbought of the American dollar, the US dollar was under the pressure from a correction against a basket of main competitors. An additional factor in the decline was the negative opening of trading on Wall Street. The overall dynamics of the US dollar index remains ascending and will be limited to support levels: 98.10 and 98.00. Resistance is located at marks: 98.30 and 98.40.
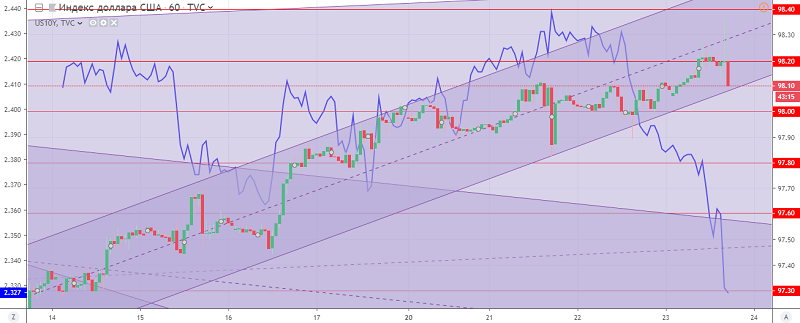
Fig. 2. The US dollar index chart. The current price is 98.10 (10-year government bonds yield is the blue line)
Read also: “VSA analysis – briefly about the main thing”
Hanzenko Anton
Earn with the help of the trade service on the news Erste News!
Topical articles of the trader’s blog:
- Cryptocurrencies as new safe haven assets
- The impact of the trade war on the US stock market
- Expectations from the AUD/USD pair for May
Current Investment ideas:
- Hewlett-Packard shares are ready to close the gap, and we are ready to close the profits!
- Several reasons to buy Walmart shares. Use the chance to earn!