Technical analysis

Technical analysis of cross-rates. (Anton Hanzenko)

Forex indicators used in Technical analysis: MACD, RSI, Ichimoku Kinko Hyo, Equal-channel, Fibonacci lines, Price Levels.

Earn with the help of the trade service on the news Erste News!


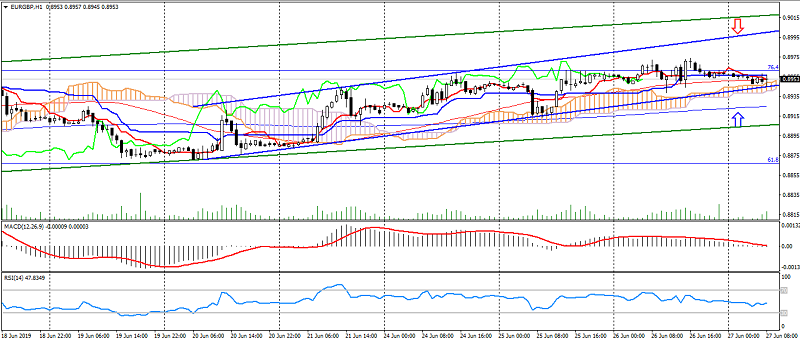
EUR GBP (current price: 0.8960)
  • Support levels: 0.8900, 0.8850, 0.8750.
  • Resistance levels: 0.9050, 0.9150, 0.9200.
  • Computer analysis: MACD (12, 26, 9) (signal – upward movement): the indicator is below 0, the signal line came out of the histogram body. RSI (14) in neutral overbought. Ichimoku Kinko Hyo (9, 26, 52) (signal – downward movement): Tenkan-sen line is lower than Kijun-sen, the price is below the cloud.
Тechnical analysis of currency pairs (Anton Hanzenko)

Forex indicators used in Technical analysis: MACD, RSI, Ichimoku Kinko Hyo, Equal-channel, Fibonacci lines, Price Levels.

Earn with the help of the trade service on the news Erste News!


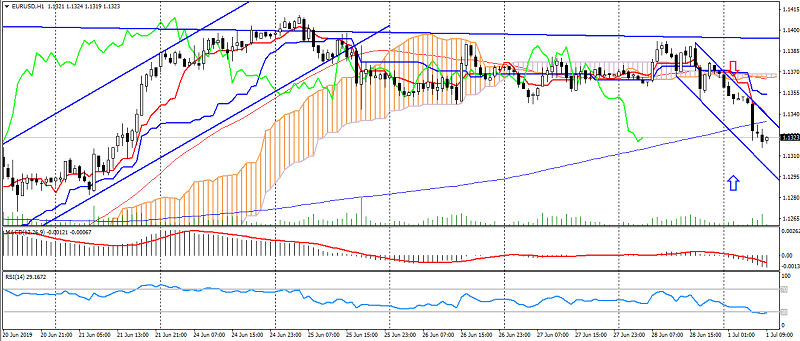
EUR USD (current price: 1.1320)

  • Support levels: 1.1350, 1.1200, 1.1100.
  • Resistance levels: 1.1450, 1.1550, 1.1650.
  • Computer analysis: MACD (12, 26, 9) (signal – downward movement): the indicator is below 0, the signal line in the body of the histogram. RSI (14) in the oversold area. Ichimoku Kinko Hyo (9, 26, 52) (signal – downward movement): Tenkan-sen line is lower than Kijun-sen, the price is below the cloud.
Technical analysis of gold and silver (Andre Green)

Forex indicators used in Technical analysis: MACD, RSI, Ichimoku Kinko Hyo, Equal-channel, Fibonacci lines, Price Levels.

Earn with the help of the trade service on the news Erste News!


Gold chart (current price: $ 1413.00)


Gold is trading in different directions on the growth of uncertainty.

Technical analysis of oil (Dani Leviant)

Forex indicators used in Technical analysis: MACD, RSI, Ichimoku Kinko Hyo, Equal-channel, Fibonacci lines, Price Levels.

Earn with the help of the trade service on the news Erste News!


The oil market on Friday demonstrates a moderate decline in maintaining uncertainty on the G20 and the upcoming OPEC + meeting.

Brent brand chart (current price: $ 66.20)


Brent is trading at the opening level of the day, slowing the uptrend.

Technical analysis of cross-rates. (Anton Hanzenko)

Forex indicators used in Technical analysis: MACD, RSI, Ichimoku Kinko Hyo, Equal-channel, Fibonacci lines, Price Levels.

Earn with the help of the trade service on the news Erste News!


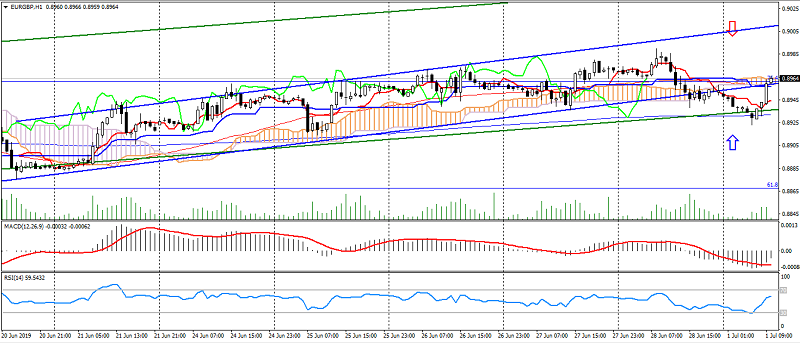
EUR GBP (current price: 0.8990)

  • Support levels: 0.8900, 0.8850, 0.8750.
  • Resistance levels: 0.9050, 0.9150, 0.9200.
  • Computer analysis: MACD (12, 26, 9) (signal – upward movement): the indicator is above 0, the signal line in the body of the histogram. RSI (14) in neutral overbought. Ichimoku Kinko Hyo (9, 26, 52) (signal – upward movement): Tenkan-sen line near Kijun-sen, the price is above the cloud.

Тechnical analysis of currency pairs (Anton Hanzenko)

Forex indicators used in Technical analysis: MACD, RSI, Ichimoku Kinko Hyo, Equal-channel, Fibonacci lines, Price Levels.

Earn with the help of the trade service on the news Erste News!


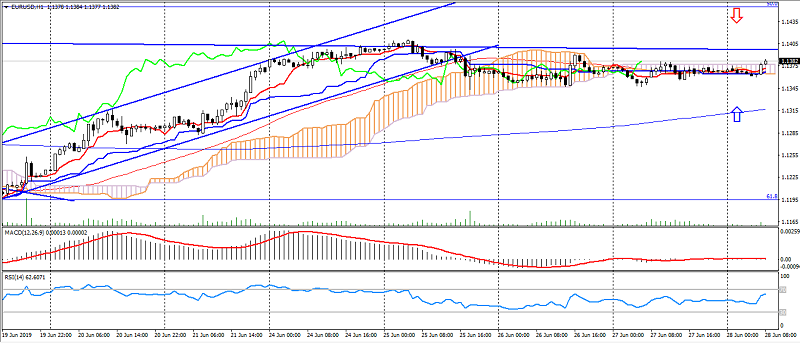
EUR USD (current price: 1.1380)

  • Support levels: 1.1350, 1.1200, 1.1100.
  • Resistance levels: 1.1450, 1.1550, 1.1650.
  • Computer analysis: MACD (12, 26, 9) (signal – flat): indicator near 0. RSI (14) in the neutral zone. Ichimoku Kinko Hyo (9, 26, 52) (signal – upward movement): Tenkan-sen line near Kijun-sen, the price is above the cloud.

Technical analysis of gold and silver (Andre Green)

Forex indicators used in Technical analysis: MACD, RSI, Ichimoku Kinko Hyo, Equal-channel, Fibonacci lines, Price Levels.

Earn with the help of the trade service on the news Erste News!


Gold chart (current price: $ 1403.00)


Gold remains under the pressure on the growth of optimism and correction after growth.

Technical analysis of oil (Dani Leviant)

Forex indicators used in Technical analysis: MACD, RSI, Ichimoku Kinko Hyo, Equal-channel, Fibonacci lines, Price Levels.

Earn with the help of the trade service on the news Erste News!


The oil market shows a decline after growth, which was previously caused by data on the reduction of oil inventories in the United States.

Brent brand chart (current price: $ 65.80)


Brent brand trades down near the opening of the day, maintaining an upward trend.

Technical analysis of cross-rates. (Anton Hanzenko)

Forex indicators used in Technical analysis: MACD, RSI, Ichimoku Kinko Hyo, Equal-channel, Fibonacci lines, Price Levels.

Earn with the help of the trade service on the news Erste News!


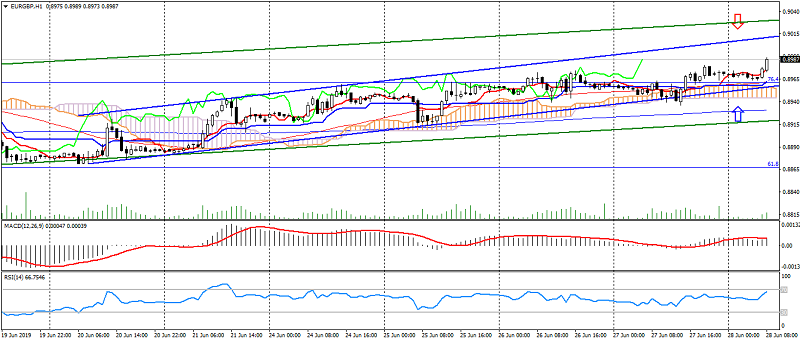
EUR GBP (current price: 0.8950)

  • Support levels: 0.8900, 0.8850, 0.8750.
  • Resistance levels: 0.9050, 0.9150, 0.9200.
  • Computer analysis: MACD (12, 26, 9) (signal – flat): the indicator is near 0. RSI (14) is in neutral overbought. Ichimoku Kinko Hyo (9, 26, 52) (signal – upward movement): Tenkan-sen line near Kijun-sen, the price is above the cloud.