
Ichimoku Kinko Hyo indicator – Works easier than it looks. Alexander Sivtsov.
At first sight, the structure of Ichimoku Kinko Hyo may seem rather complicated, but it is only at first sight. In fact, Ichimoku Kinko Hyo is the same set of trend indicators: moving averages, as well as support or resistance lines. The indicator was developed by Japanese analyst Goichi Hosoda, who worked under his pen-name Ichimoku Sanjin. Initially, the indicator was intended to work with the Japanese Nikkei index, but as it turned out, it also works great with other financial instruments.
Let’s get to the point: Ichimoku Kinko Hyo
Before you start working with this indicator, you need to understand what each of its elements means.
- Tenkan-sen – it is the red line that shows the average value between the sum of the maximum and minimum prices for the first time interval.
- Kijun-sen – it is the blue line of the indicator that shows the average value for the second time interval.
- Senkou Span A and Senkou Span B – are the top and bottom lines of the cloud that form resistance or support levels. Different histogram colors indicate upward or downward movement in the market. A cloud of golden color indicates an upward dynamics; a gray cloud indicates a downward dynamics in the market. The histogram of the cloud is shifted forward by 26 periods and makes it possible to predict the further price movement.
- Chinkou Span – it is light green line and is formed at the closing prices of the candlestick, with an offset of 26 periods ago.
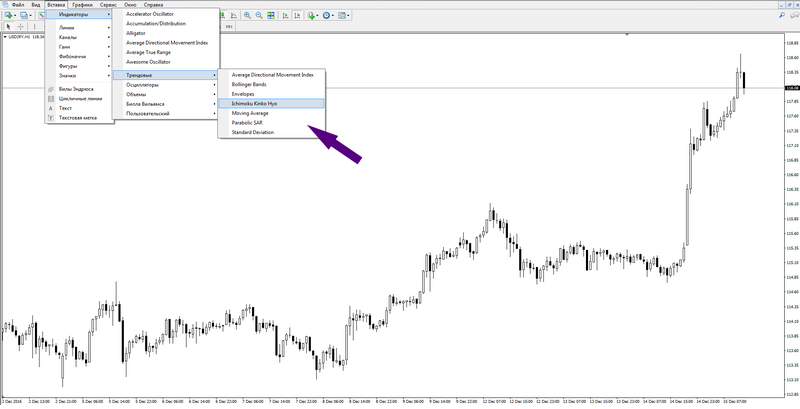
This indicator is in the Insert menu, Indicators, Trend, Ichimoku Kinko Hyo. It is recommended to save its default settings while working with the indicator.
A set of tools allows you to use several options for trading with it.
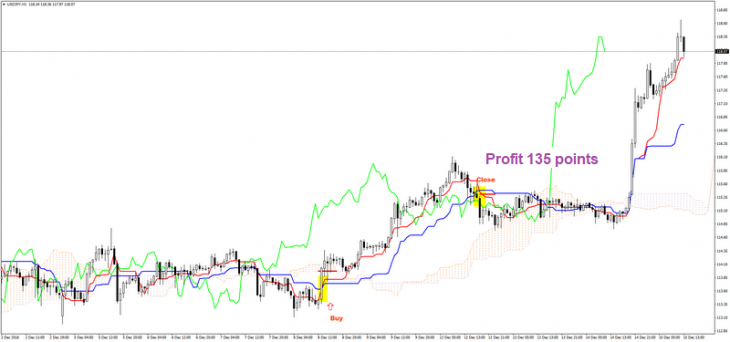
- Option 1) Crossing Ichimoku lines
The red line of the indicator (Tenkan-sen) crosses the blue from the bottom up (Kijun-sen) – it is a buy signal. The crossing of Tenkan-sen and Kijun-sen lines from top to bottom will be a sell signal. Based on these signals, the closing of the transaction happens at the reverse crossing of Tenkan-sen and Kijun-sen.
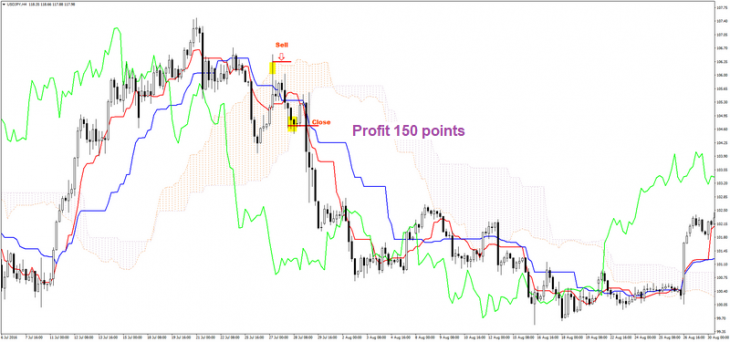
- Option 2) Trade in the clouds
When the price hits the cloud, the lines of Senkou Span A and Senkou Span B (cloud borders) begin to play the role of support and resistance lines, from which you can make deals on Buy or Sell. The closing of the transaction happens when the price reaches the opposite side of the cloud. Noteworthy in this strategy is that the deal should be concluded in the direction of the trend or in the direction of Tenkan-sen and Kijun-sen. It is better to use this strategy on H4 or D1 timeframes.
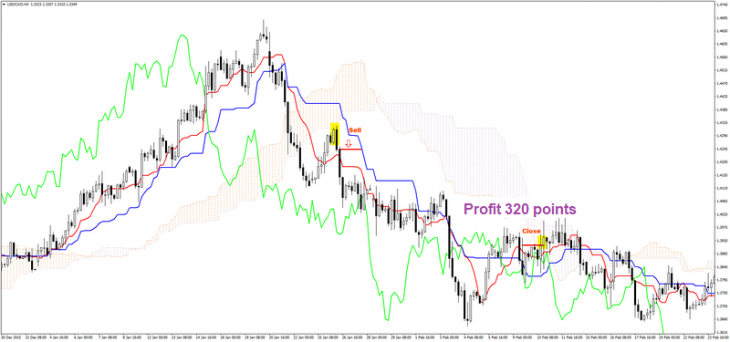
- Option 3) A rebound from the clouds
This strategy is a rebound of the price from the Ichimoku cloud. Cloud lines serve as support or resistance, from which you can expect a price reversal. The signal to enter a trade is a rebound of the candlestick from the cloud and forming a reversal candlestick. The transaction is closed, then when the closing price of the candlestick will be in the cloud Ichimoku. I recommend to use this strategy on H4 and D1 timeframes.
If you want to learn better trading with the help of the Ichimoku Kinko Hyo indicator or with the help of any other tool, we invite you to receive training from Ester Holdings Inc. specialists.
Follow the Trader’s Blog, and suggest topics in the Trader’s Blog – write to info@esterholdings.com.
Alexander Sivtsov