
Тechnical analysis of currency pairs (Anton Hanzenko)
EUR USD (current price: 1.2260)
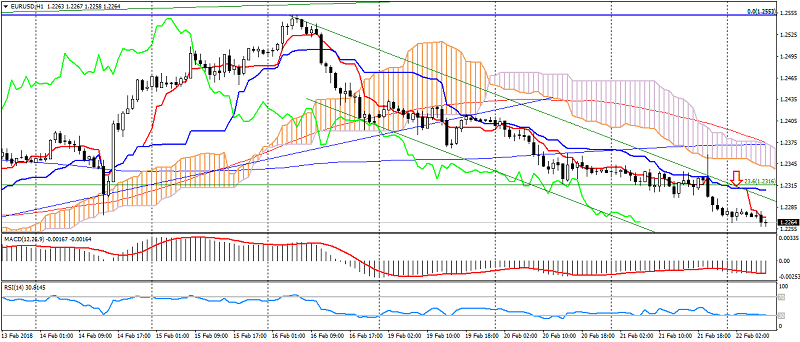
- Support levels: 1.2100 (September 2017 maximum), 1.1900, 1.1700.
- Resistance levels: 1.2600, 1.2750 (March 2013 minimum), 1.2270 (November 2014 minimum).
- Computer analysis: MACD (12,26,9) (signal – downward movement): the indicator is below 0, the signal line is in the body of the histogram. RSI (14) is in the oversold zone. IchimokuKinkoHyo (9,26,52) (signal – downward movement): the Tenkan-sen line is below the Kijun-sen line, the price is below the cloud.
- The main recommendation: sale entry is started from 1.2300, 1.2320, 1.2350.
- Alternative recommendation: buy entry is started from 1.2240, 1.2200, 1.2170.
The euro dollar pair accelerated the decline on positive expectations of a rate hike in the US, thereby maintaining a downtrend in the pair and opening the way to the lows of February.
GBP USD (current price: 1.3880)
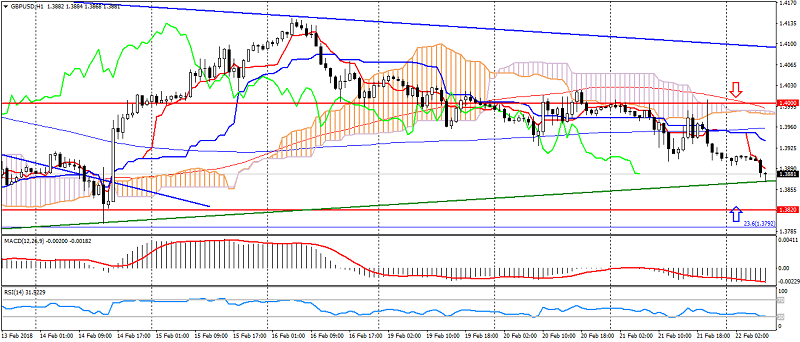
- Support levels: 1.4000 (April 2016 minimum), 1.3820, 1.3650 (September 2017 maximum).
- Resistance levels: 1.4350, 1.4500, 1.4750 (May May 2016 maximum).
- Computer analysis: MACD (12,26,9) (signal – downward movement): the indicator is below 0, the signal line is in the body of the histogram. RSI (14) is in the oversold zone. IchimokuKinkoHyo (9,26,52) (signal – downward movement): the Tenkan-sen line is below the Kijun-sen line, the price is below the cloud.
- The main recommendation: sale entry is started from 1.39330, 1.3960, 1.4000.
- Alternative recommendation: buy entry is started from 1.3850, 1.3820, 1.3800.
The British pound is also weakened due to the growth of the American, but this pair is limited to a side triangle, which may indicate retreat.
USD CHF (current price: 0.9400)
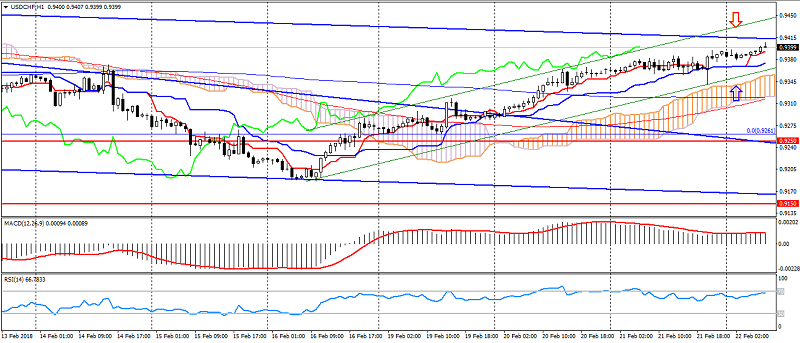
- Support levels: 0.9250 (August 2015 minimum), 0.9150, 0.9050 (May 2015 minimum).
- Resistance levels:, 0.9550, 0.9800, 1.0030 (November 2017 maximum).
- Computer analysis: MACD (12,26,9) (signal – upward movement): the indicator is above 0, the signal line is in the body of the histogram. RSI (14) is in the overbought zone. IchimokuKinkoHyo (9,26,52) (signal – upward movement): the Tenkan-sen line is above the Kijun-sen line, the price is higher than the cloud.
- The main recommendation: sale entry is started from 0.920, 0.9450, 0.9470.
- Alternative recommendation: buy entry is started from 0.9380, 0.9350, 0.9320.
The Swiss franc remains in the weekly downtrend, confining itself to psychology 0.9400, from which it is possible to repel.
USD JPY (current price: 107.40)
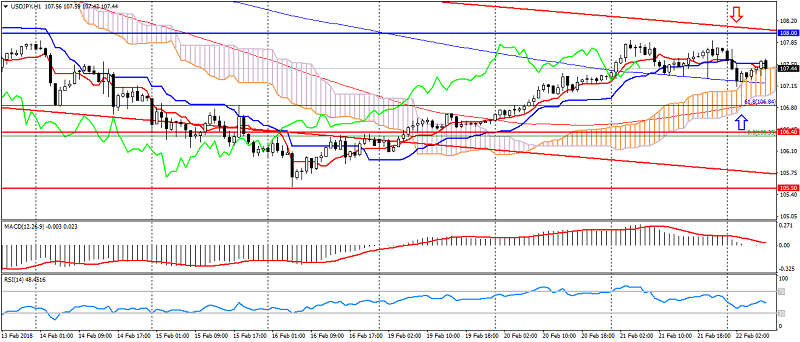
- Support levels: 106.40, 105.50, 104.50.
- Levels of resistance: 108.00, 108.60, 110.00.
- Computer analysis: MACD (12, 26, 9) (signal – downward movement): the indicator is above 0, the signal line has left the histogram bar. RSI (14) is in the neutral zone. IchimokuKinkoHyo (9,26,52) (signal – downward movement, flat): the Tenkan-sen line is below the Kijun-sen line, the price is higher than the cloud.
- The main recommendation: sale entry is started from 107.70, 108.80, 108.30.
- Alternative recommendation: buy entry is started from 107.00, 106.80, 106.40.
The Japanese yen receives support on the flight of investors from risks and growth in crosses and maintaining of the annual downtrend.
USD CAD (current price: 1.2700)
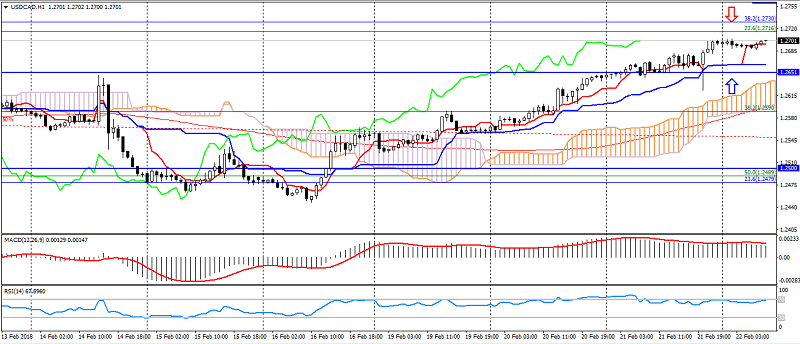
- Support levels: 1.2340.1.2200, 1.2060 (at least 2017).
- Resistance levels: 1.2500, 1.2650, 1.2770 (August 2017 maximum).
- Computer analysis: MACD (12, 26, 9) (signal – downward movement): the indicator is above 0, the signal line has left the histogram bar. RSI (14) is in the overbought zone. IchimokuKinkoHyo (9,26,52) (signal – upward movement): the Tenkan-sen line is above the Kijun-sen line, the price is higher than the cloud.
- The main recommendation: sale entry is started from 1.2720, 1.2750, 1.2780.
- Alternative recommendation: buy entry is started from 1.2670, 1.2650, 1.2620.
The Canadian dollar continues to remain under the pressure of the weekly downtrend, limited to overbought and resistance levels of 1.2750-30.
AUD USD (current price: 0.7790)
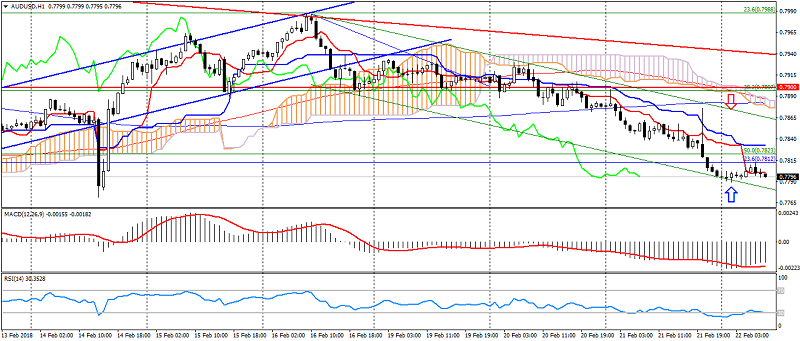
- Support levels: 0.7900, 0.7700 (March 2017 maximum), 0.7500.
- Resistance levels: 0.8120 (2017 maximum), 0.8200, 0.8290 (2014 maximum).
- Computer analysis: MACD (12, 26, 9) (signal – upward movement): the indicator is below 0, the signal line left the body of the histogram. RSI (14) is in the oversold zone. IchimokuKinkoHyo (9,26,52) (signal – downward movement): the Tenkan-sen line is below the Kijun-sen line, the price is below the cloud.
- The main recommendation: sale entry is started from 0.7830, 0.7850, 0.7880.
- Alternative recommendation: buy entry is started from 0.7780, 0.7750, 0.7720.
The Australian accelerated the decline on the growth of the American, but further decline in the pair is limited to oversold, which may cause correction.
NZD USD (current price: 0.7310)
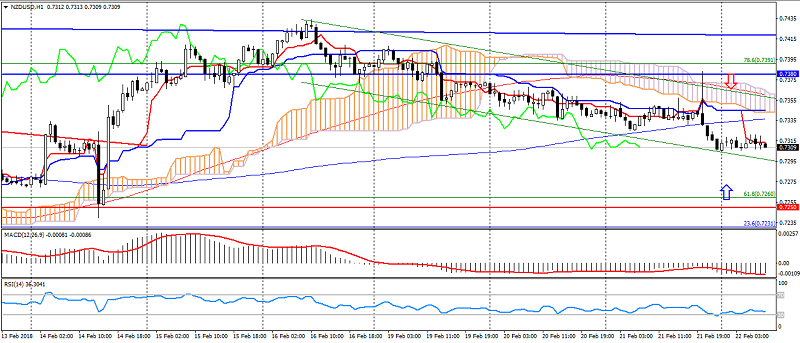
- Support levels: 0.7250, 0.7130 (August 2017 minimum), 0.7000.
- Resistance levels: 0.7380, 0.7450, 0.7550 (2017 maximum).
- Computer analysis: MACD (12, 26, 9) (signal- downward movement): the indicator is below 0, the signal line is in the body of the histogram RSI (14) is in the neutral zone. IchimokuKinkoHyo (9,26,52) (signal – downward movement): the line Tenkan-sen is below the line Kijun-sen, the price is in the cloud.
- The main recommendation: sale entry is started from 0.7330, 0.7350, 0.7380.
- Alternative recommendation: buy entry is started from 0.7290, 0.7270, 0.7250.
The New Zealand dollar keeps a downward trend on the resumption of overall downward dynamics.
XAU USD (current price: 1321.00)
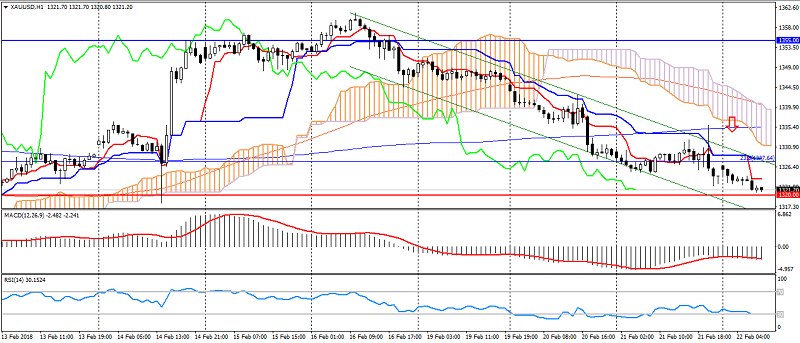
- Support levels: 1320.00, 1303.00, 1280.00.
- Resistance levels: 1355.00 (May May 2016 maximum), 1374.00, 1290.00 (March 2016 maximum).
- Computer analysis: MACD (12, 26, 9) (signal – downward movement): the indicator is below 0, the signal line is in the body of the histogram. RSI (14) is in the oversold zone. IchimokuKinkoHyo (9,26,52) (signal – downward movement): the Tenkan-sen line is below the Kijun-sen line, the price is in the clouds.
- The main recommendation: sale entry is started from 1325.00, 1328.00, 13426.00.
- Alternative recommendation: buy entry is started from 1320.00, 1315.00, 1311.00.
Gold remains in the correction phase due to the repulsion from the highs, forming the second top of the figure “double top”.