
Данные по ВВП США
- ВВП (кв/кв) (1 кв.), факт 3,2%, прогноз 2,0%.
- Дефлятор ВВП (кв/кв) (1 кв.), факт 0,6%, прогноз 1,3%.
Данные по ВВП США за первый квартал превзошли все ожидания рынка, показав значительный рост экономики США и указав на замедление нисходящей динамики, которая прослеживалась с сентября 2018 года. Но вот дефлятор ВВП замедлился к минимальным значениям 2016 года, указав на замедление инфляции в США, что выступило основным фактором риска развития экономики США.
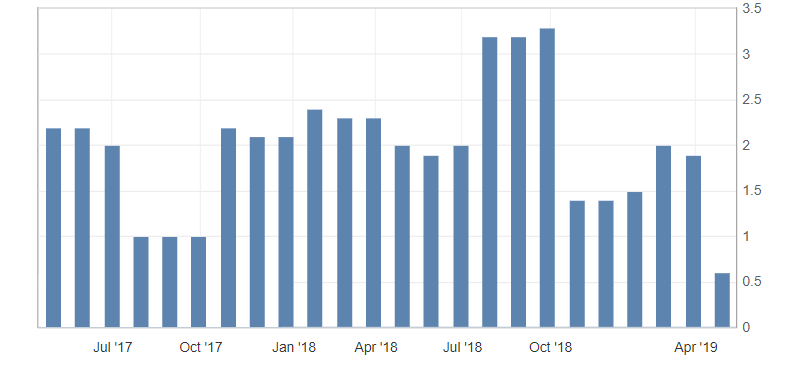
Рис. 1. График дефлятора ВВП (кв кв) США
Индекс доллара США отреагировал на неоднозначные данные обновлением максимума на уровне 98.30, но после ослаб на рисках замедления инфляции и вернулся в устоявшийся боковой диапазон. Также стоит отметить, что дальнейшее снижение американца возможно на коррекции, но будет ограниченно весьма позитивными данными по росту ВВП. Таким образом снижение индекса доллара США ограничивается уровнями поддержки: 98.00 и 97.80.
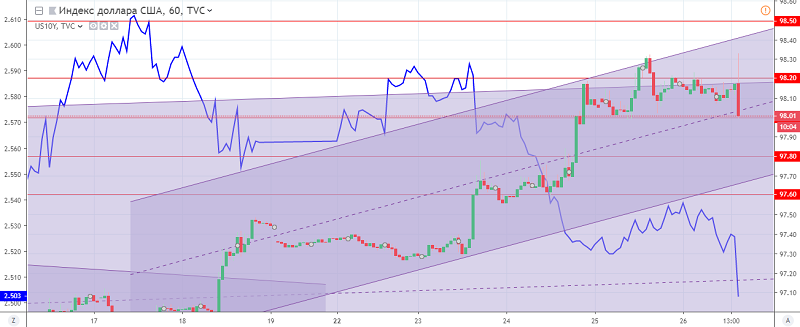
Рис. 2. График индекса доллара США. Текущая цена – 98.00 (доходность 10-ти летних гос. облигаций – синяя линия)
Читайте также: «Разбогатеть легко, но попробуйте остаться богатым»
Ганзенко Антон
Зарабатывайте с помощью сервиса торговли на новостях Erste News!
Актуальные статьи Блога трейдера:
- Многофакторный анализ рынка Forex
- Ожидания от пары USD/JPY на конец апреля — начало мая
- Торговая война США и ЕС
Актуальные Инвестиционные идеи: