
Stock indices: Asia-Pacific region
While considering the major world stock indices in the US, the euro zone, the UK and Japan, it is worth to single out the stock indices of the Asia-Pacific region int0 a separate group, which include such large economies as Australia, Hong Kong and China.
Stock indices of the Asia-Pacific region together with the Japanese index are of interest because they actually set the tone of trading at the start of the day, thus indicating the prospects for further movement of the stock markets after the American session in the middle of the week and the mood at the start of the week. Often there is a correction in the Asian-Pacific trading session against trading in the US session. And you can find often the expression in the market “the Asian session corrects the mistakes of the American”. This is due to the correctional model of market movement. So, after rising or falling at trades in America, trading in the Asia-Pacific region is going the other way, thereby adjusting the market.
The Australian stock exchange is represented by the S & P/ASX 200 index and includes 200 “blue chips”. There are also less popular derivatives from this index that include a different number of companies S & P / ASX 50, S & P / ASX 100 and S & P / ASX 300.
Companies that are part of the S & P/ASX 200 index are mainly represented by the financial and commodity sector.
S & P / ASX 200 Index chart
The HangSeng Index contains 50 Hong Kong companies and represents the Hong Kong Stock Exchange.
HangSeng Index chart
The Shanghai Stock Exchange is subject to the PRC government and in fact this exchange is divided into two parts:
- one part of the shares is traded for the yuan inside the country,
- and the second for US dollars in the international market and is limited to quotas.
The main stock indices of the Shanghai Stock Exchange are SSE Composite, that includes all shares traded on the stock exchange. And the index of SSE 50 includes 50 “blue chips” of China.
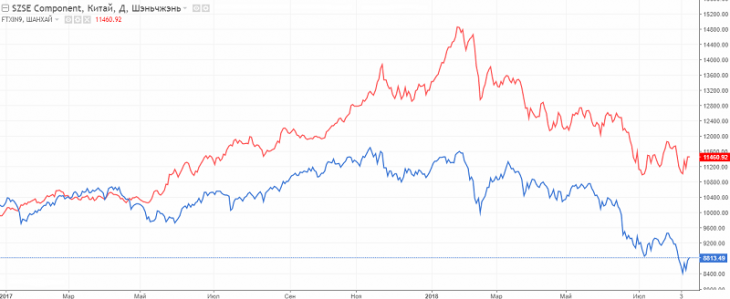
SSE Composite (blue line) and SSE 50 (red line) chart
Anton Hanzenko