Technical analysis of currency pairs (Anton Hanzenko)
EUR USD (current price: 1.1820)
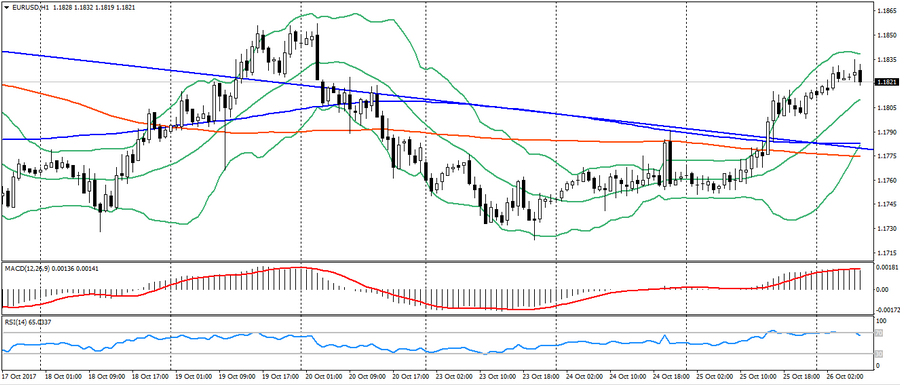
- Support levels: 1.1700 (maximum of August 2015), 1.1600(maximum of 2016), 1.1470.
- Resistence levels: 1.2000, 1.2100, 1.2270 (minimum of 2014).
- Computer analysis: MACD (signal – upward motion): the indicator is above 0, the signal line in the body of the histogram. RSI is in the overbought zone. Bollinger Bands (period 20): neutral, declining volatility.
Technical analysis of currency pairs (Anton Hanzenko)
EUR USD (current price: 1.1750)
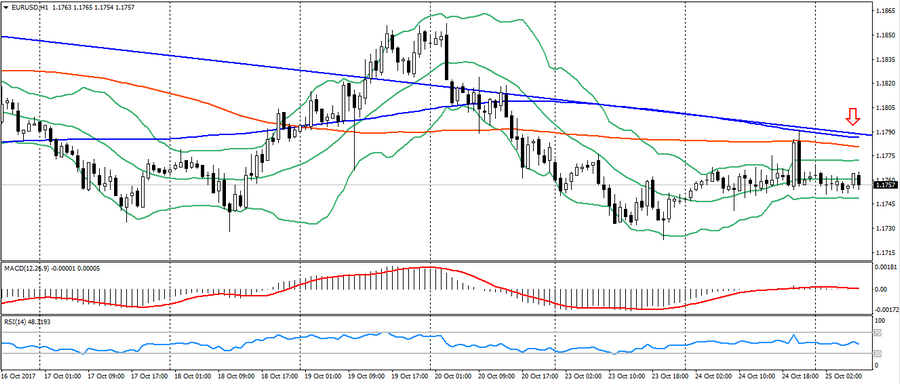
- Support levels: 1.1700 (August 2015 maximum), 1.1600 (2016 maximum), 1.1470.
- Resistance levels: 1.2000, 1.2100, 1.2270 (November 2014 minimum).
- Computer analysis: MACD (signal-flat): indicator is near 0. RSI is in the neutral zone. Bollinger Bands (period 20): neutral, low volatility.
Oil Technical Analysis (Alexander Sivtsov)
Oil is trading in the red zone during the Asian session.
Brent (current price: $ 5818.3 per 100 barrels)
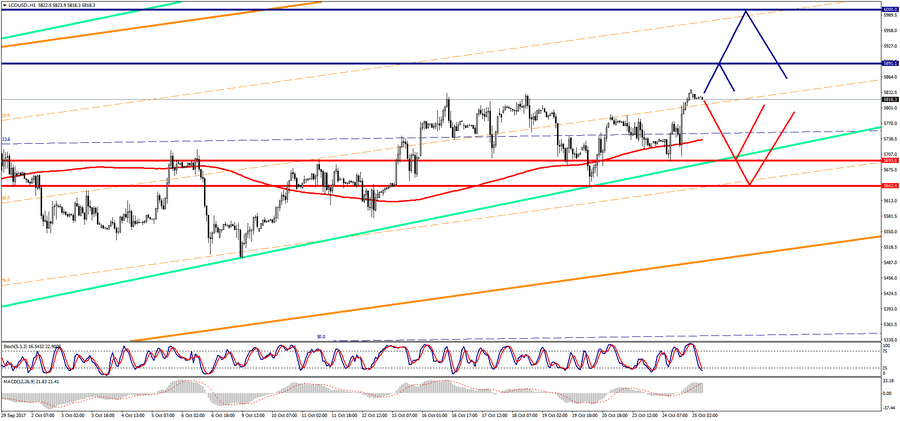
Brent is trading near the zero mark during the Asian session.
Oil Technical Analysis (Alexander Sivtsov)
Oil is trading in the green zone during the Asian session.
Brent (current price: $ 5735.8 per 100 barrels)
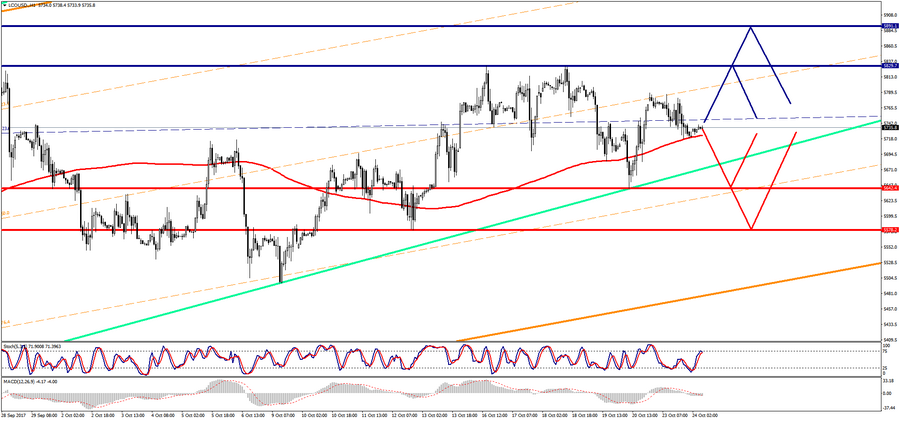
Brent is trading above the zero mark during the Asian session.
Technical analysis of currency pairs (Anton Hanzenko)
EUR USD (current price: 1.1760)
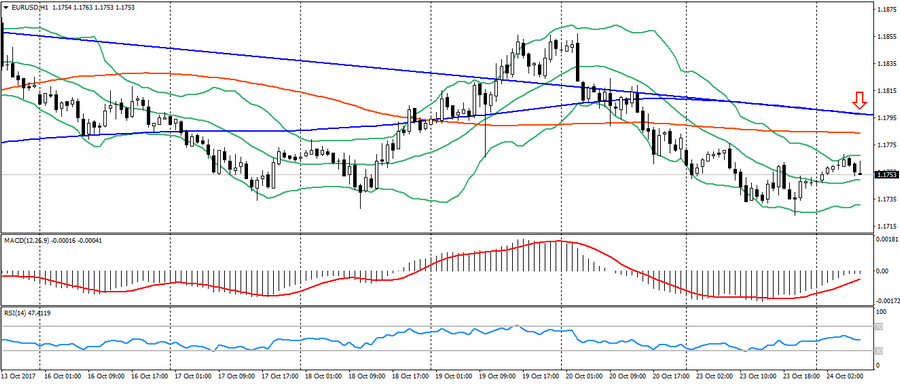
- Support levels: 1.1700 (maximum of 2015), 1.1600(maximum of 2016), 1.1470.
- Resistence levels: 1.2000, 1.2100, 1.2270 (minimum of November 2014).
- Computer analysis: MACD (signal – upward motion): the indicator is below 0, the signal line has left the body of the histogram. RSI is in the neutral zone. Bollinger Bands (period 20): neutral, declining volatility.
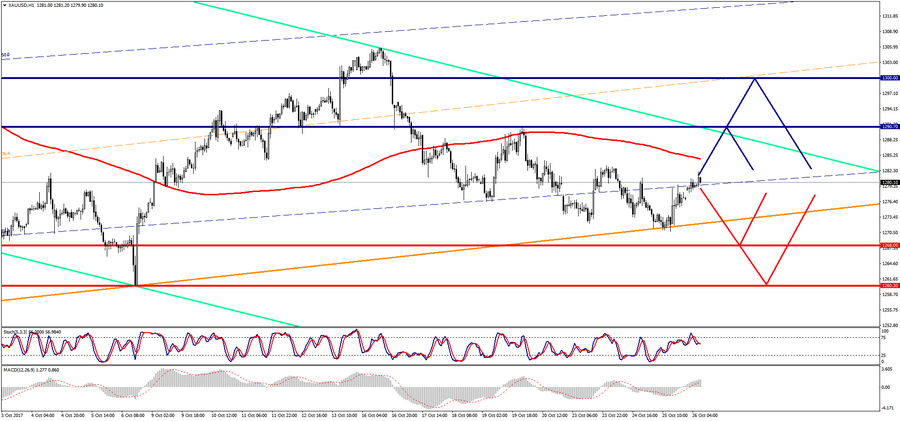
Technical analysis of gold and silver (Alexander Sivtsov)
Gold (current price: $ 1280.50)
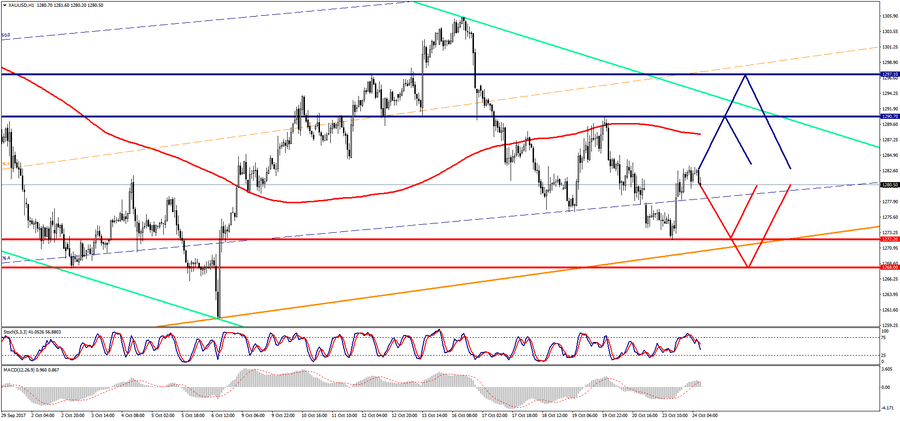
Gold is trading slightly above the zero mark during the Asian session.
Oil Technical Analysis (Alexander Sivtsov)
Oil is trading in the green zone during the Asian session.
Brent (current price: $ 5773.5 per 100 barrels)
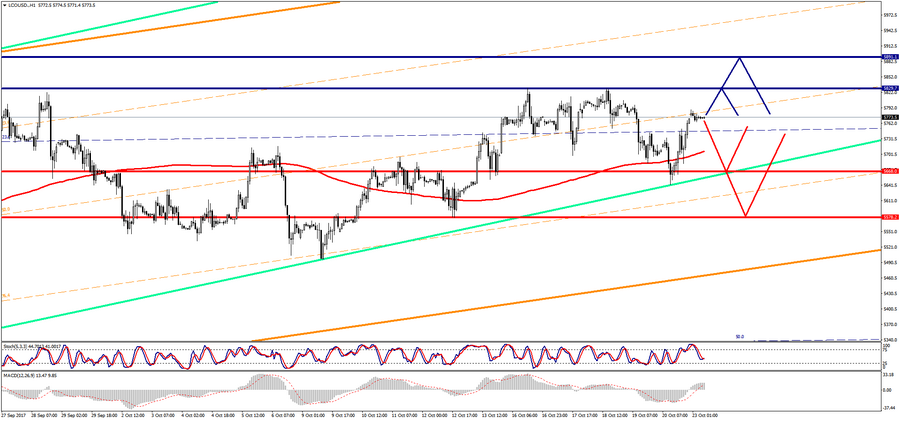
Brent is trading above the zero mark during the Asian session.