技术分析

Oil Technical Analysis (Alexander Sivtsov)

Oil is trading below the zero mark during the Asian session.

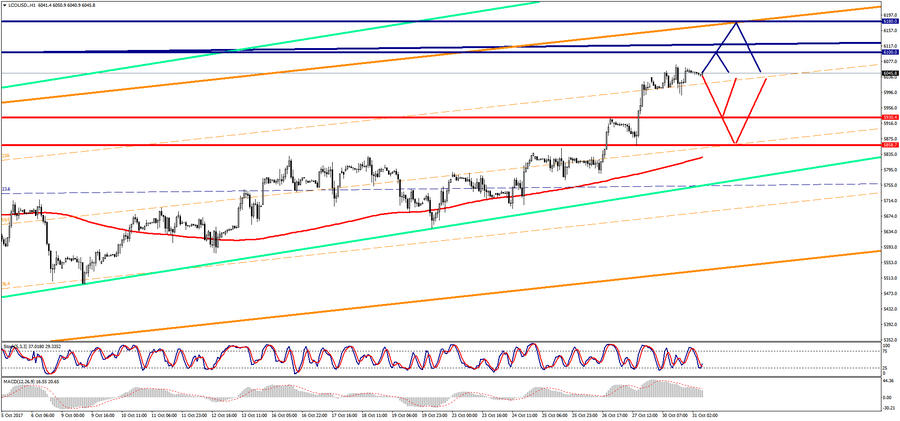
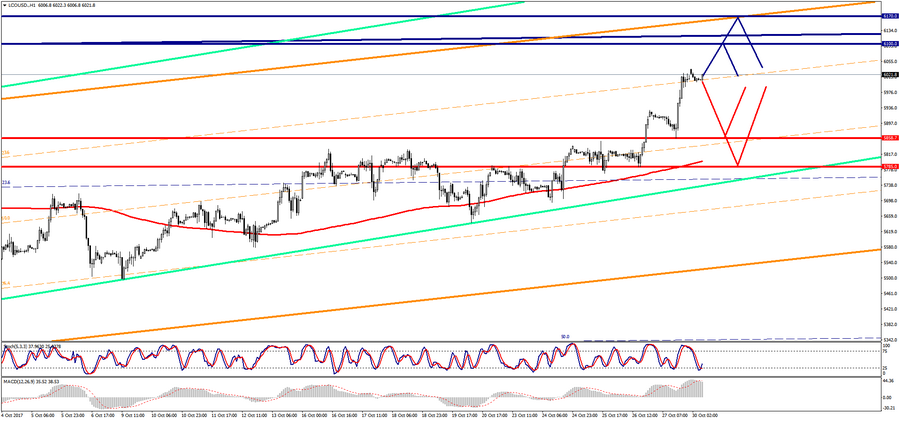
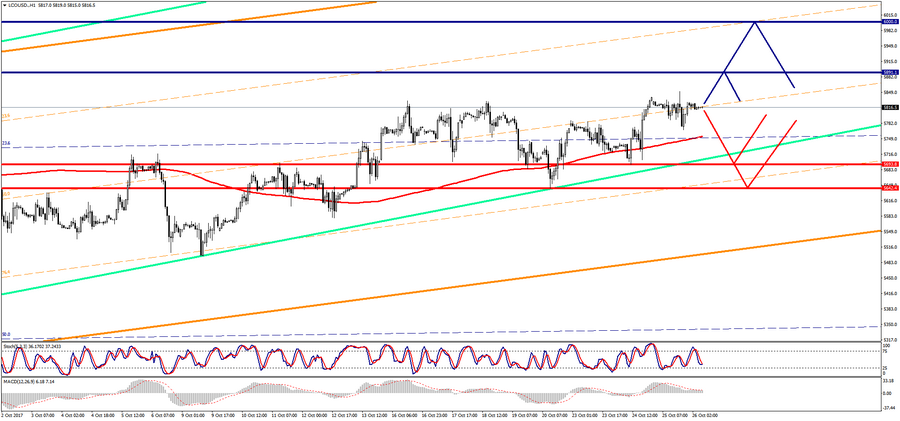
Brent (current price: $ 6045.8 per 100 barrels)

Brent is trading just below the zero mark during the Asian session.

Technical analysis of currency pairs (Anton Hanzenko)

EUR USD (current price: 1.1630)

  • Support levels: 1.1700 (August 2015 maximum), 1.1600 (2016 maximum), 1.1470.
  • Resistance levels: 1.2000, 1.2100, 1.2270 (November 2014 minimum).
  • Computer analysis: MACD (signal – upward motion): the indicator is above 0, signal line is in the body of the histogram. RSI is in the neutral zone. Bollinger Bands (period 20): neutral, declining volatility.

Oil Technical Analysis (Alexander Sivtsov)

Oil is trading near the zero mark during the Asian session.

Brent (current price: $ 6021.8 per 100 barrels)

Brent is trading just above the zero mark during the Asian session.

Technical analysis of currency pairs (Anton Hanzenko)

EUR USD (current price: 1.1600)

  • Support levels: 1.1700 (August 2015 maximum), 1.1600 (2016 maximum), 1.1470.
  • Resistance levels: 1.2000, 1.2100, 1.2270 (November 2014 minimum).
  • Computer analysis: MACD (signal – upward motion): the indicator is below 0, the signal line has left the body of the histogram. RSI is in the neutral zone. Bollinger Bands (period 20): neutral, declining volatility.

Technical analysis of currency pairs (Anton Hanzenko)

EUR USD (current price: 1.1620)

  • Support levels: 1.1700 (August 2015 maximum), 1.1600 (2016 maximum), 1.1470.
  • Resistance levels: 1.2000, 1.2100, 1.2270 (November 2014 minimum).
  • Computer analysis: MACD (signal – upward motion): the indicator is below 0, the signal line has left the body of the histogram. RSI is in the oversold zone. Bollinger Bands (period 20): neutral, declining volatility.

Oil Technical Analysis (Alexander Sivtsov)

Oil is trading near the zero mark during the Asian session.

Brent (current price: $ 5816.5 per 100 barrels)

Brent is trading near the zero mark during the Asian session.