
Technical analysis of currency pairs (Anton Hanzenko)
EUR USD (current price: 1.1620)
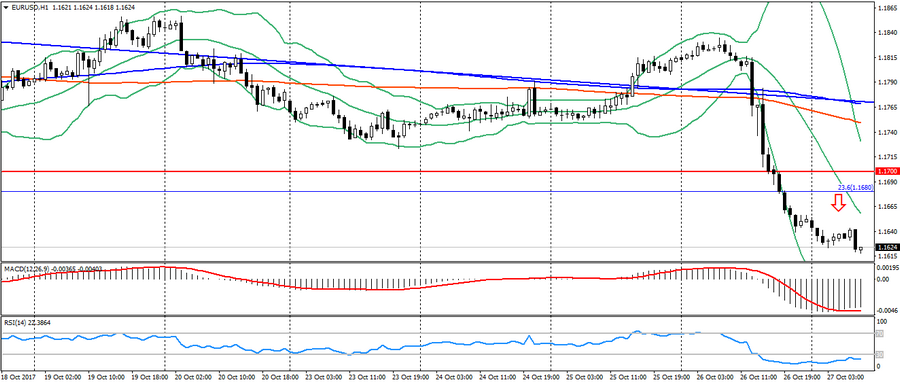
- Support levels: 1.1700 (August 2015 maximum), 1.1600 (2016 maximum), 1.1470.
- Resistance levels: 1.2000, 1.2100, 1.2270 (November 2014 minimum).
- Computer analysis: MACD (signal – upward motion): the indicator is below 0, the signal line has left the body of the histogram. RSI is in the oversold zone. Bollinger Bands (period 20): neutral, declining volatility.
- The main recommendation: sale entry is started from 1.1650, 1.1680 (Fibo 23.6 from December 2016), 1.1700 (strong psychology).
- Alternative recommendation: buy entry is started from 1.1600 (strong psychology), 1.1580 (MA 200), 1.1550.
The Euro remains to trade under pressure after the ECB’s soft rhetoric. The given pair continues to trade with decrease, but it is limited to considerable oversold zone. Therefore, the entrance for sale should be considered after correction
GBP USD (current price: 1.3100)
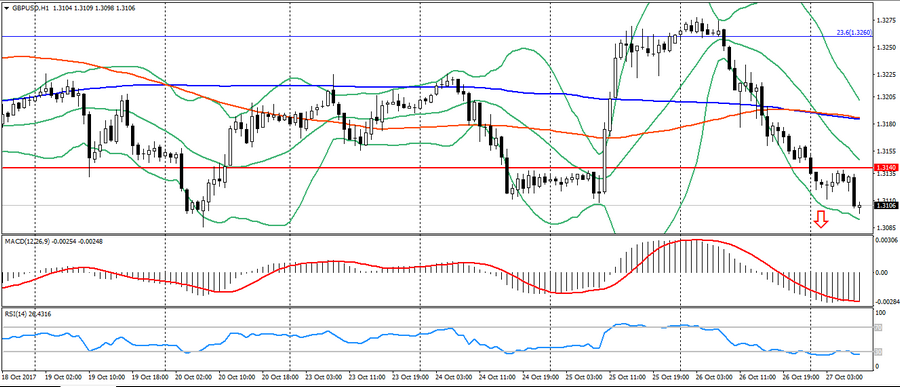
- Support levels: 1.3140, 1.2900, 1.2740 (August 2017 minimum).
- Resistance levels: 1.3500, 1.3660, 1.3830 (February 2016 minimum).
- Computer analysis: MACD (signal – downward motion): the indicator is below 0, the signal line is in the body of the histogram. RSI is in the oversold zone. Bollinger Bands (period 20): neutral, declining volatility.
- The main recommendation: sale entry is started from 1.3150, 1.3190 (MA 200), 1.3220.
- Alternative recommendation: buy entry is started from 1.3100 (psychology), 1.3070, 1.3020 (Fibo. 38.2 from January).
The British pound also remains to trade lower and in the oversold zone, limiting itself to the lows of past weeks. So, it is possible to repel. But from these levels it is also possible to resume the decline.
USD CHF (current price: 0.9990)

- Support levels: 0.9700, 0.9600, 0.9530.
- Resistance levels: 1.0000, 1.0050, 1.0100 (May maximum).
- Computer analysis: MACD (signal – downward motion): the indicator is higher than 0, the signal line has left the body of the histogram. RSI is in the overbought zone. Bollinger Bands (period 20): neutral, declining volatility.
- The main recommendation: sale entry is started from 1.0000 (strong psychology), 1.0030, 1.0060.
- Alternative recommendation: buy entry is started from 0.9950, 0.9930, 0.9900 (MA 100).
The Swiss franc also remains under pressure, but is limited to significant resistance.
USD JPY (current price: 114.20)
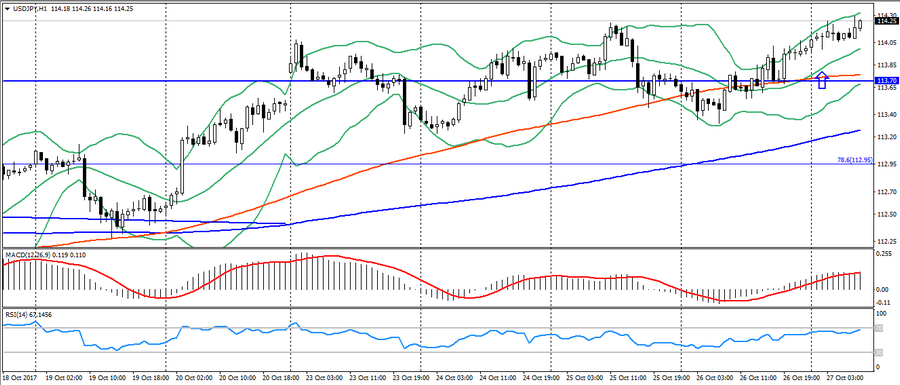
- Support levels: 108.90, 108.10 (April 2017 minimum ), 107.30 (2017 minimum ).
- Resistance levels: 113.70, 114.50 (July 2017 maximum), 115.00.
- Computer analysis: MACD (signal – upward motion): the indicator is above 0, the signal line is in the body of the histogram. RSI is in the neutral zone. Bollinger Bands (period 20): neutral, declining volatility.
- The main recommendation: sale entry is started from 114.30, 114.50 (July maximum), 114.80.
- Alternative recommendation: buy entry is started from 113.70, 113.30, 112.90 (Fibo. 78.6 from the maximum of July).
The Japanese yen is trading with a slight decrease, remaining under pressure of optimism.
USD CAD (current price: 1.2880)
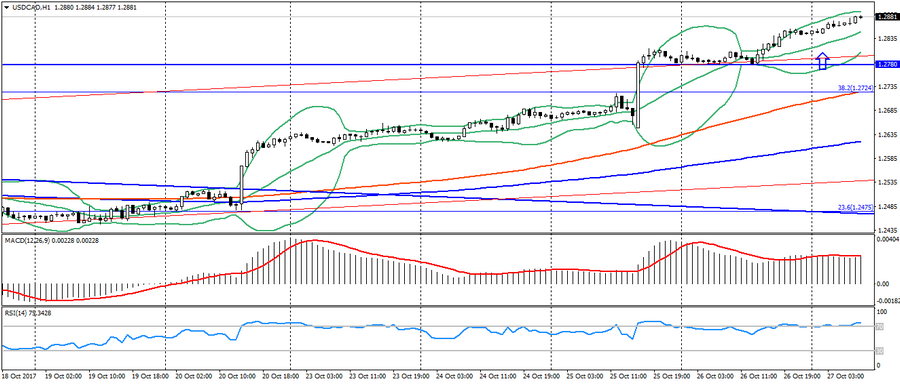
- Support levels: 1.2200, 1.2060 (2017 minimum), 1.1950 (2015 minimum).
- Resistance levels: 1.2780 (August 2017 maximum), 1.3000, 1.3160.
- Computer analysis: MACD (signal – upward motion): indicator above 0, signal line in the body of the histogram. RSI is in the overbought zone. Bollinger Bands (period 20): neutral, declining volatility.
- The main recommendation: sale entry is started from 1.2900, 1.2920 (Fibo, 50.0 from the May’s maximum), 1.2950.
- Alternative recommendation: buy entry is started from 1.2780, 1.2730 (Fibo, 38.2 from the May’s maximum), 1.2650.
The Canadian dollar is still trading lower on weak data on Canada.
AUD USD (current price: 0.7630)
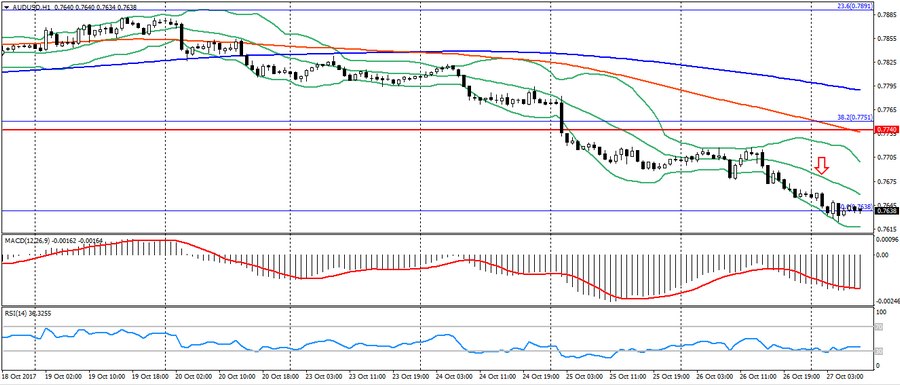
- Support levels: 0.7740, 0.7320 (2017 minimum), 0.7120.
- Resistance levels: 0.8120 (2017 maximum), 0.8200, 0.8290 (2014 maximum).
- Computer analysis: MACD (signal – downward motion): the indicator is below 0, the signal line in the body of the histogram. RSI is in the oversold zone. Bollinger Bands (period 20): neutral, declining volatility.
- The main recommendation: sale entry is started from 0.7670, 0.7690 (MA 200 to D1), 0.7720.
- Alternative recommendation: buy entry is started from 0.7630 (Fibo, 50.0 from the low of December 2016), 0.7600, 0.7570 (July’s low).
The Australian dollar remains trading near the monthly lows to maintain the downtrend.
NZD USD (current price: 0.6830)

- Support levels: 0.7000, 0.6930, 0.6820 (the minimum of the current year).
- Resistance levels: 0.7380, 0.7450, 0.7550 (2017 maximum).
- Computer analysis: MACD (signal – upward motion): the indicator is below 0, the signal line has left the body of the histogram. RSI is in the neutral zone. Bollinger Bands (period 20): neutral, low volatility.
- The main recommendation: sale entry is started from 0.6870, 0.6900 (MA 100), 0.6930.
- Alternative recommendation: buy entry is started from 0.6820 (the minimum of the current year), 0.6800, 0.6780.
The New Zealand dollar remains in a downward trend, keeping the potential for decline.
XAU USD (current price: 1265.00)
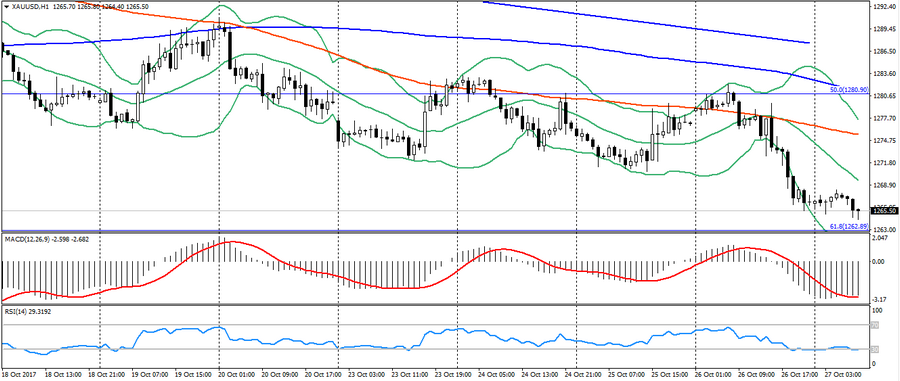
- Support levels: 1250.00, 1226.00, 1200.00.
- Resistance levels: 1340.00, 1355.00, 1374.00 (2016 maximum).
- Computer analysis: MACD (signal – downward motion): the indicator is below 0, the signal line is in the body of the histogram. RSI is in the oversold zone. Bollinger Bands (period 20): neutral, declining volatility.
- The main recommendation: sale entry is started from 1270.00, 1275.00 (MA 200), 1280.00 (Fibo.50.0 from the low of July).
- Alternative recommendation: buy entry is started from 1262.00 (Fibo 61.8 from the July’s low), 1258.00 (MA 200 per D1), 1250.00.
Gold remains under pressure, but is limited to the lows of the month.