
Technical analysis of currency pairs (Anton Hanzenko)
EUR USD (current price: 1.1600)
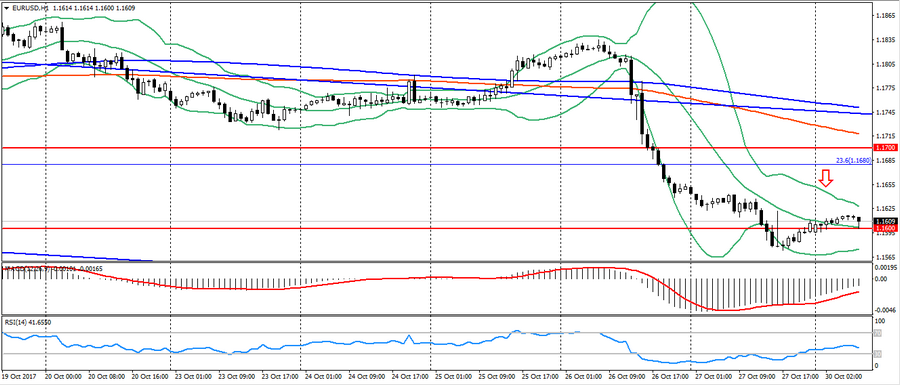
- Support levels: 1.1700 (August 2015 maximum), 1.1600 (2016 maximum), 1.1470.
- Resistance levels: 1.2000, 1.2100, 1.2270 (November 2014 minimum).
- Computer analysis: MACD (signal – upward motion): the indicator is below 0, the signal line has left the body of the histogram. RSI is in the neutral zone. Bollinger Bands (period 20): neutral, declining volatility.
- The main recommendation: sale entry is started from 1.1640, 1.1680 (Fibo 23.6 from December 2016), 1.1700 (strong psychology).
- Alternative recommendation: buy entry is started from 1.1600 (strong psychology), 1.1570, 1.1550.
Friday’s expectations for the pair were justified, and the estimated profit was 50 points. Also, the euro remains in some uncertainty due to a correction against Friday, which will be limited to Friday highs and the growing political crisis in Catalonia. This increases pressure on this pair.
GBP USD (current price: 1.3130)
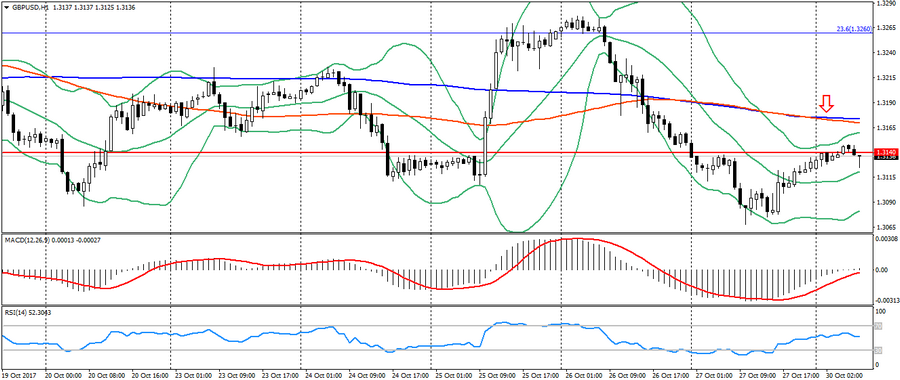
- Support levels: 1.3140, 1.2900, 1.2740 (August 2017 minimum).
- Resistance levels: 1.3500, 1.3660, 1.3830 (February 2016 minimum).
- Computer analysis: MACD (signal – upward motion): indicator above 0, signal line is in the body of the histogram. RSI is in the neutral zone. Bollinger Bands (period 20): neutral, growing volatility.
- The main recommendation: sale entry is started from 1.3170 (MA 200), 1.3200, 1.3230.
- Alternative recommendation: buy entry is started from 1.3100 (psychology), 1.3070, 1.3020 (Fibo. 38.2 from January).
The expected decrease in the British pound was around 20-30 points, but the pair continues to maintain a sideways trend. Dynamics of the pair GBP/USD remains limited to a wide sideways trend.
USD CHF (current price: 0.9980)

- Support levels: 0.9700, 0.9600, 0.9530.
- Resistance levels: 1.0000, 1.0050, 1.0100 (May maximum).
- Computer analysis: MACD (signal – downward motion): the indicator is higher than 0, the signal line has left the body of the histogram. RSI is in the neutral zone. Bollinger Bands (period 20): neutral, growing volatility.
- The main recommendation: sale entry is started from 1.0000 (strong psychology), 1.0030, 1.0060.
- Alternative recommendation: buy entry is started from 0.9930 (MA 100), 0.9880, 0.9860 (MA 200).
The Swiss franc remains under pressure of the American, trading within the limits of Friday. This indicates the growth potential of this pair.
USD JPY (current price: 113.20)

- Support levels: 108.90, 108.10 (April 2017 minimum), 107.30 (2017 minimum).
- Resistance levels: 113.70, 114.50 (July 2017 maximum), 115.00.
- Computer analysis: MACD (signal – downward motion): the indicator is below 0, the signal line is in the body of the histogram. RSI is in the neutral zone. Bollinger Bands (period 20): neutral, declining volatility.
- The main recommendation: sale entry is started from 113.80 (MA 100), 114.20, 114.40 (July maximum).
- Alternative recommendation: buy entry is started from 113.40 (MA 200), 113.20, 112.90 (Fibo. 78.6 from the maximum of July).
The Japanese yen continues to trade with a slight decrease in correction and growing fears. As a result, Friday’s expectations were not justified. Given the noticeable appreciation of the yen, one should expect growth of this pair on the move against Friday.
USD CAD (current price: 1.2830)
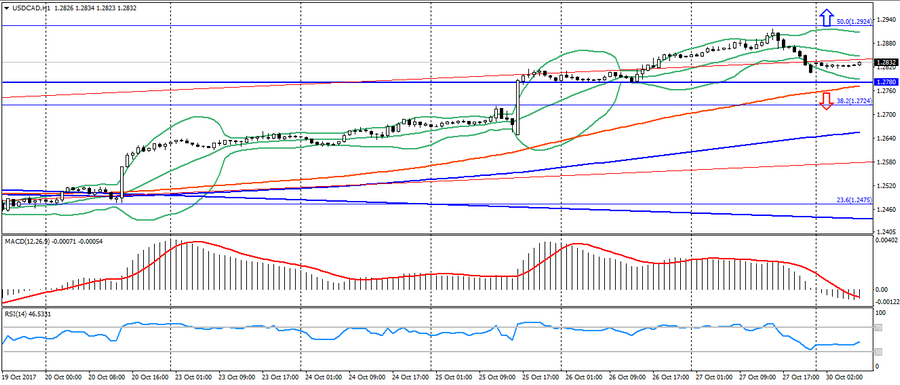
- Support levels: 1.2200, 1.2060 (2017 minimum), 1.1950 (2015 minimum).
- Resistance levels: 1.2780 (August 2017 maximum), 1.3000, 1.3160.
- Computer analysis: MACD (signal – downward motion): the indicator is below 0, the signal line is in the body of the histogram. RSI is in the neutral zone. Bollinger Bands (period 20): neutral, growing volatility.
- The main recommendation: sale entry is started from 1.2850, 1.2890, 1.2930 (Fibo.50.0 from the May maximum).
- Alternative recommendation: buy entry is started from 1.2780, 1.2760 (MA 100), 1.2730 (Fibo. 38.2 from the May maximum).
The Canadian dollar justified expectations in part (30-40 points). After, it fought off a significant level of 1.2920. The pair remains in some uncertainty due to low-key dynamics and repelling from a significant resistance level, which caused a slowdown in the uptrend.
AUD USD (current price: 0.7660)
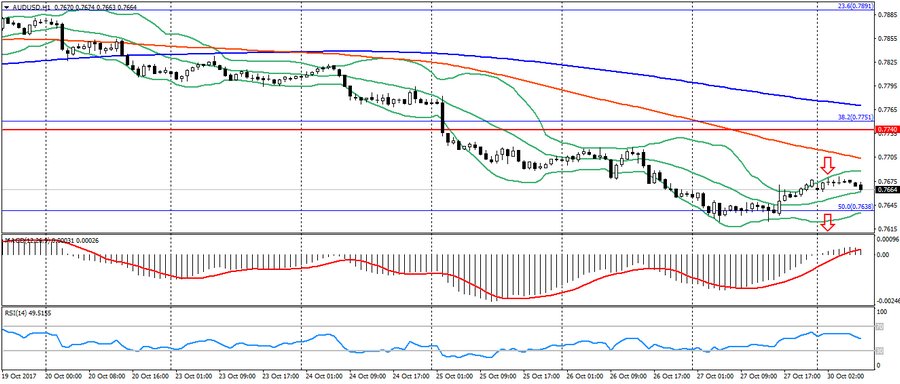
- Support levels: 0.7740, 0.7320 (2017 minimum), 0.7120.
- Resistance levels: 0.8120 (2017 maximum), 0.8200, 0.8290 (2014 maximum).
- Computer analysis: MACD (signal – upward motion): indicator above 0, signal line is in the body of the histogram. RSI is in the neutral zone. Bollinger Bands (period 20): neutral, declining volatility.
- The main recommendation: sale entry is started from 0.7690 (MA 200 on D1), 0.7720, 0.7750 (Fibo. 38.2 from the low of December 2016).
- Alternative recommendation: buy entry is started from 0.7630 (Fibo. 50.0 from the low of December 2016), 0.7620, 0.7570 (July’s low).
The Australian dollar did not live up to expectations and remained trading in flat near significant support. But, the potential for a decline in the pair is significant
NZD USD (current price: 0.6840)
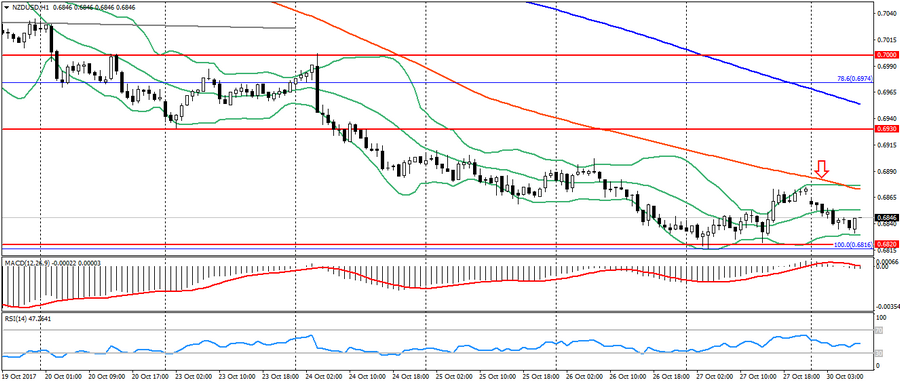
- Support levels: 0.7000, 0.6930, 0.6820 (minimum of the current year).
- Resistance levels: 0.7380, 0.7450, 0.7550 (2017 maximum).
- Computer analysis: MACD (signal – downward motion): the indicator is higher than 0, the signal line has left the body of the histogram. RSI is in the neutral zone. Bollinger Bands (period 20): neutral, low volatility.
- The main recommendation: sale entry is started from 0.6870 (MA 100), 0.6900, 0.6930.
- Alternative recommendation: buy entry is started from 0.6820 (minimum of the current year), 0.6800, 0.6780.
The New Zealand dollar also remains near significant support, the low of this year, trading in a sideways trend. The pair retains the potential to decline on the breakthrough of this support.
XAU USD (current price: 1269.00)
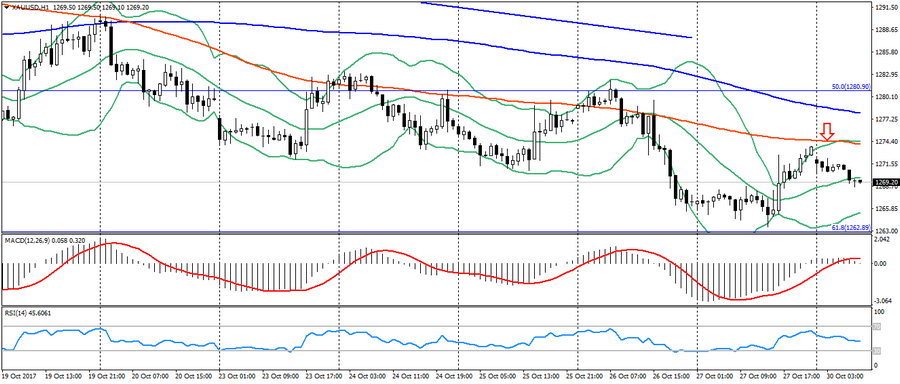
- Support levels: 1250.00, 1226.00, 1200.00.
- Resistance levels: 1340.00, 1355.00, 1374.00 (2016 maximum).
- Computer analysis: MACD (signal – downward motion): the indicator is higher than 0, the signal line has left the body of the histogram. RSI is in the neutral zone. Bollinger Bands (period 20): neutral, declining volatility.
- The main recommendation: sale entry is started from 1274.00 (MA 100), 1278.00 (MA 200), 1280.00 (Fibo.50.0 from the low of July).
- Alternative recommendation: buy entry is started from 1266.00, 1262.00 (Fibo. 61.8 from the July low), 1258.00 (MA 200 on D1).
Gold remains under pressure of a downtrend, but is limited to the lows of the month.