
Technical analysis of currency pairs (Anton Hanzenko)
EUR USD (current price: 1.1630)
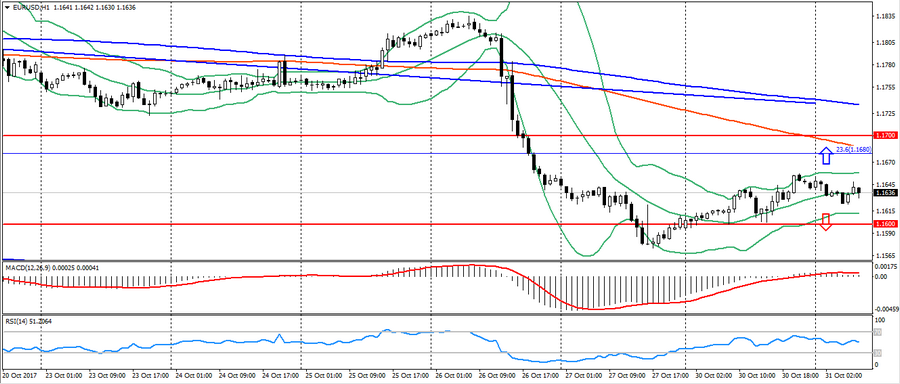
- Support levels: 1.1700 (August 2015 maximum), 1.1600 (2016 maximum), 1.1470.
- Resistance levels: 1.2000, 1.2100, 1.2270 (November 2014 minimum).
- Computer analysis: MACD (signal – upward motion): the indicator is above 0, signal line is in the body of the histogram. RSI is in the neutral zone. Bollinger Bands (period 20): neutral, declining volatility.
- The main recommendation: sale entry is started from 1.1660, 1.1680 (Fibo. 23.6 from December 2016), 1.1700 (strong psychology).
- Alternative recommendation: buy entry is started from 1.1600 (strong psychology), 1.1570, 1.1550.
Expectations for further weakening of the euro remain in force, despite the continued correction. The pair EUR/USD continues to maintain its potential for decline, but is limited by the forthcoming news on the euro area.
GBP USD (current price: 1.3210)

- Support levels: 1.3140, 1.2900, 1.2740 (August 2017 minimum).
- Resistance levels: 1.3500, 1.3660, 1.3830 (February 2016 minimum).
- Computer analysis: MACD (signal – downward motion): the indicator is above 0, signal line is in the body of the histogram. RSI is in the neutral zone. Bollinger Bands (period 20): neutral, declining volatility.
- The main recommendation: sale entry is started from 1.3220, 1.3260 (Fibo. 23.6 from January), 1.3280.
- Alternative recommendation: buy entry is started from 1.3170 (MA 200), 1.3140, 1.3080.
The British pound continues to strengthen against most competitors on the correction of positions before the meeting of the Bank of England and the possibility of raising rates.
USD CHF (current price: 0.9950)

- Support levels: 0.9700, 0.9600, 0.9530.
- Resistance levels: 1.0000, 1.0050, 1.0100 (May maximum).
- Computer analysis: MACD (signal – upward motion): the indicator is below 0, the signal line is in the body of the histogram. RSI is in the neutral zone. Bollinger Bands (period 20): neutral, growing volatility.
- The main recommendation: sale entry is started from 0.9980, 1.0000 (strong psychology), 1.0040.
- Alternative recommendation: buy entry is started from 0.9930, 0.9880 (MA 200), 0.9860.
The Swiss franc has lived up to expectations for a break from significant resistance. But it is too early to talk about the development of the correction due to forthcoming news on the eurozone.
USD JPY (current price: 113.10)

- Support levels: 108.90, 108.10 (April 2017 minimum), 107.30 (2017 minimum).
- Resistance levels: 113.70, 114.50 (July 2017 maximum), 115.00.
- Computer analysis: MACD (signal – upward motion): the indicator is below 0, the signal line has left the body of the histogram. RSI is in the neutral zone. Bollinger Bands (period 20): neutral, declining volatility.
- The main recommendation: sale entry is started from 113.50 (MA 200), 113.70, 114.00.
- Alternative recommendation: buy entry is started from 112.90 (Fibo. 78.6 from the July’s maximum), 112.70, 112.50 (MA 200 per H4).
The Japanese yen appreciably strengthened on the American correction and flight from risks. At the beginning of the day, the yen weakened based on news that the monetary policy of Bank of Japan remains unchanged. This pair remains near the significant level of support 112.90 and the formation of correction is possible.
USD CAD (current price: 1.2830)

- Support levels: 1.2200, 1.2060 (2017 minimum), 1.1950 (2015 minimum).
- Resistance levels: 1.2780 (August 2017 maximum), 1.3000, 1.3160.
- Computer analysis: MACD (signal-flat): the indicator is near 0. RSI is in the neutral zone. Bollinger Bands (period 20): neutral, low volatility.
- The main recommendation: sale entry is started from 1.2870, 1.2900, 1.2930 (Fibo.50.0 from the May maximum).
- Alternative recommendation: buy entry is started from 1.2800, 1.2780 (MA 100), 1.2730 (Fibo. 38.2 from the May’s maximum).
The Canadian dollar continues to trade in a sideways trend, maintaining a downtrend, but limiting itself to four-month highs. There will be a significant data on Canada today, which will clarify the situation.
AUD USD (current price: 0.7670)
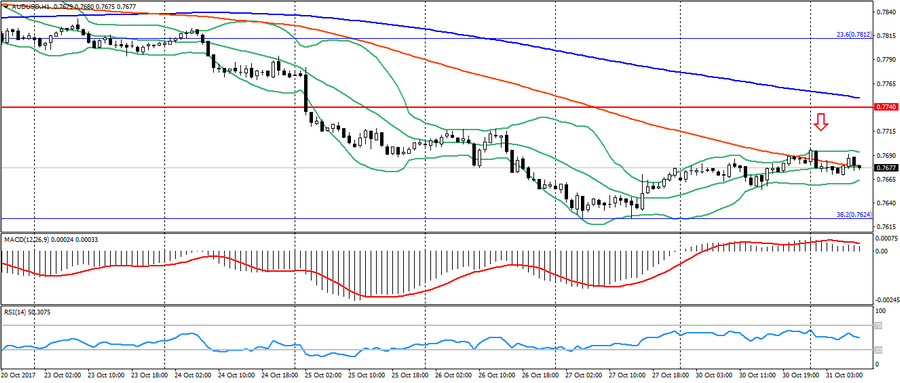
- Support levels: 0.7740, 0.7320 (2017 minimum), 0.7120.
- Resistance levels: 0.8120 (2017 maximum), 0.8200, 0.8290 (2014 maximum).
- Computer analysis: MACD (signal – downward motion): the indicator is higher than 0, the signal line has left the body of the histogram. RSI is in the neutral zone. Bollinger Bands (period 20): neutral, declining volatility.
- The main recommendation: sale entry is started from 0.7700, 0.7720, 0.7740.
- Alternative recommendation: buy entry is started from 0.7660, 0.7620 (Fibo. 38.2 from the low of January 2016), 0.7570 (July low).
Despite the formation of a reversal and a lateral trend, the pair AUD/USD continues to maintain its potential to decline, which confirms a downward trend.
NZD USD (current price: 0.6850)

- Support levels: 0.7000, 0.6930, 0.6820 (the minimum of the current year).
- Resistance levels: 0.7380, 0.7450, 0.7550 (2017 maximum).
- Computer analysis: MACD (signal – downward motion): the indicator is higher than 0, the signal line has left the body of the histogram. RSI is in the neutral zone. Bollinger Bands (period 20): neutral, low volatility.
- The main recommendation: sale entry is started from 0.6880, 0.6920 (MA 200), 0.6930.
- Alternative recommendation: buy entry is started from 0.6840, 0.6820 (the low of the current year), 0.6780.
The New Zealand dollar weakened early in the day based on weak data. As a result, this pair remains trading near the year’s low, waiting for data on employment in New Zealand.
XAU USD (current price: 1275.00)

- Support levels: 1250.00, 1226.00, 1200.00.
- Resistance levels: 1340.00, 1355.00, 1374.00 (2016 maximum).
- Computer analysis: MACD (signal – downward motion): the indicator is higher than 0, the signal line has left the body of the histogram. RSI is in the neutral zone. Bollinger Bands (period 20): neutral, declining volatility.
- The main recommendation: sale entry is started from 1279.00, 1280.00 (Fibo. 50.0 from the low of July), 1283.00.
- Alternative recommendation: buy entry is started from 1273.00 (MA 100), 1269.00, 1262.00 (Fibo. 61.8 from the July’s low).
Gold remains in the sideways trend after noticeable growth yesterday. Given the current downtrend, further growth in the pair will be limited.