
Oil Technical Analysis (Alexander Sivtsov)
Oil is trading in the green zone during the Asian session.
Brent (current price: $ 5773.5 per 100 barrels)
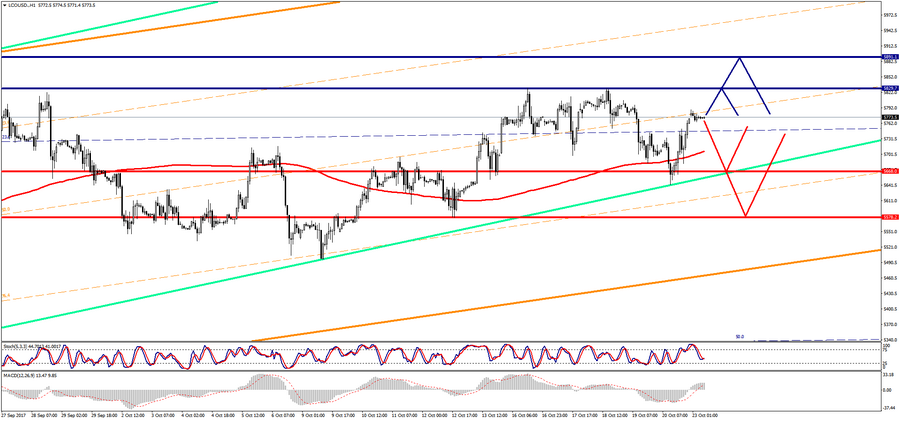
Brent is trading above the zero mark during the Asian session.
Resistance 1: From $ 5829.70 (maximum of October 16)
Resistance 2: From $ 5891.10 (maximum of September 26)
Support 1: From $ 5668.00 (support line Up of the channel on H1)
Support 2: From $ 5578.20 (minimum of October 12)
Computer analysis: Movings on the indicator Stochastic Oscillator on the chart of the price of H4 are in the overbought zone. Also, according to the MACD indicator on the D1 chart, a bearish divergence is formed, against which the possibility of reducing the Brent price remains.
WTI (current price: $ 5210.3 per 100 barrels)
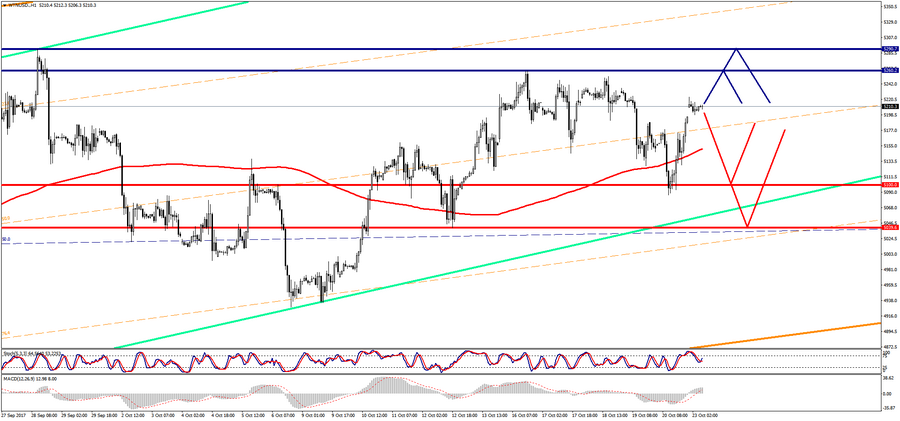
WTI is trading above the zero mark during the Asian session.
Resistance 1: From $ 5260.20 (maximum of October 16)
Resistance 2: From $ 5,290.70 (maximum of September 28)
Support 1: From $ 5100.00 (psychological level)
Support 2: From $ 5039.60 (minimum of October 12)
Computer analysis: On the H4 chart, Stochastic Oscillator movings are in the overbought zone. The MACD indicator on the D1 chart forms a bearish divergence. That is why one should expect a decrease in the price of the WTI brand.