
Technical analysis of currency pairs (Anton Hanzenko)
EUR USD (current price: 1.1760)
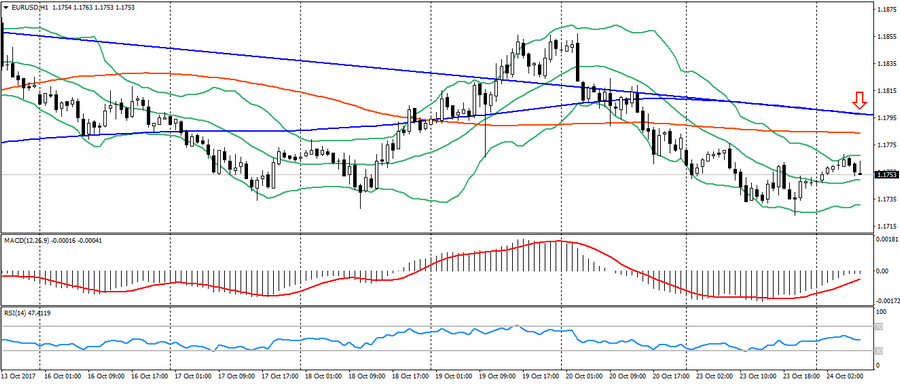
- Support levels: 1.1700 (maximum of 2015), 1.1600(maximum of 2016), 1.1470.
- Resistence levels: 1.2000, 1.2100, 1.2270 (minimum of November 2014).
- Computer analysis: MACD (signal – upward motion): the indicator is below 0, the signal line has left the body of the histogram. RSI is in the neutral zone. Bollinger Bands (period 20): neutral, declining volatility.
- The main recommendation: sale entry is started from 1.1780 (MA 100), 1.1800 (MA 200), 1.1820.
- Alternative recommendation: buy entry is started from 1.1730, 1.1700, 1.1680 (Fibo. 23,6 from December’s low of the last year).
Euro remains trading under pressure, maintaining a downward trend on the overall strengthening of the American. But also the pair remains in some uncertainty because of the forthcoming meeting of the ECB
GBP USD (current price: 1.3200)
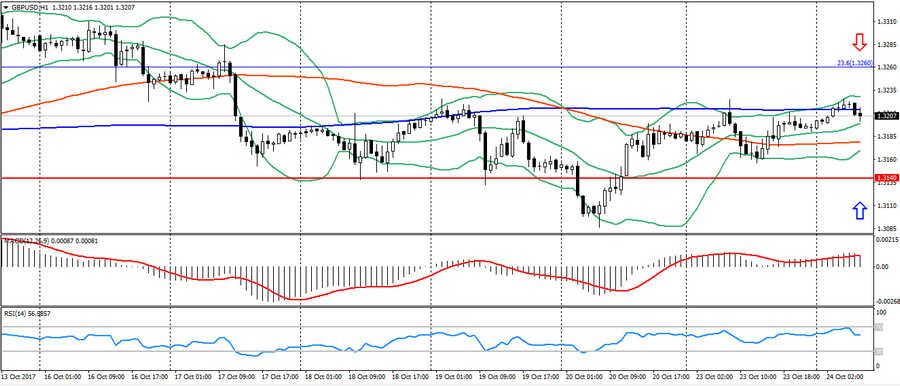
- Support levels: 1.3140, 1.2900, 1.2740 (minimum of August 2017 ).
- Resistence levels: 1.3500, 1.3660, 1.3830(minimum of February 2016 ).
- Computer analysis: MACD (signal – upward motion): the indicator is above 0, the signal line is in the body of the histogram. RSI is in the neutral zone. Bollinger Bands (period 20): neutral, low volatility.
- The main recommendation: sale entry is started from 1.3230, 1.3260 (Fibo. 23,6 from January of the current year), 1.3300.
- Alternative recommendation: buy entry is started from 1.3170 (MA 100), 1.3140, 1.3100.
The British pound also remains trading restrainedly positively, limiting itself to the existing lateral trend.
USD CHF (current price: 0.9860)
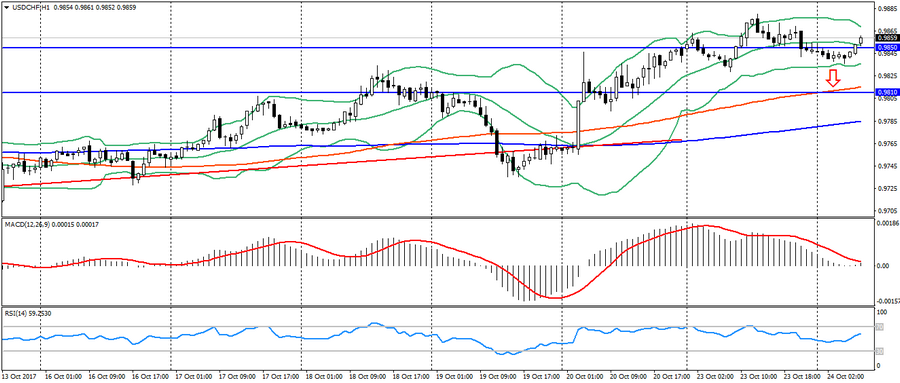
- Support levels: 0.9600, 0.9530, 0.9440 (minimum of July 2017).
- Resistence levels: 0.9810, 0.9850, 0.9900.
- Computer analysis: MACD (signal – downward motion): indicator is above 0, the signal line has left the body of the histogram. RSI is in the neutral zone. Bollinger Bands (period 20): neutral, low volatility.
- The main recommendation: sale entry is started from 0.9880, 0.9900, 0.9930.
- Alternative recommendation: buy entry is started from 0.9810 (MA 100), 0.9780 (MA 200), 0.9740.
The Swiss frank trading downward, remaining under pressure from the American, but limited to a noticeable overbought and divergence of the MACD indicator.
USD JPY (current price:113.50)
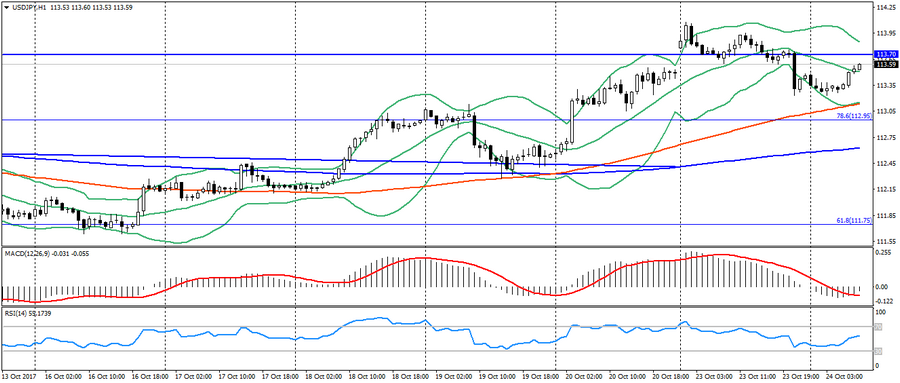
- Support levels: 108.90, 108.10 (minimum of April 2017 ), 107.30 (minimum of 2017 ).
- Resistence levels: 113.70, 114.50 (maximum of July 2017 ), 115.00.
- Computer analysis: MACD (signal – downward motion): the indicator is below 0, the signal line in the body of the histogram. RSI is in the neutral zone. Bollinger Bands (period 20): neutral, declining volatility.
- The main recommendation: sale entry is started from 113.70 (maximum of the month), 114.00, 114.20.
- Alternative recommendation: buy entry is started from 113.10 (MA 100), 112.90 (Fibo. 78.6 from July’s high), 112.60 (MA 200).
The Japanese yen is trading with a decrease after yesterday’s growth and correction of stock indices. The given pair also remains near significant resistance levels, which introduces some uncertainty into the trades, but at the same time the medium-term uptrend persists.
USD CAD (current price:1.2650)
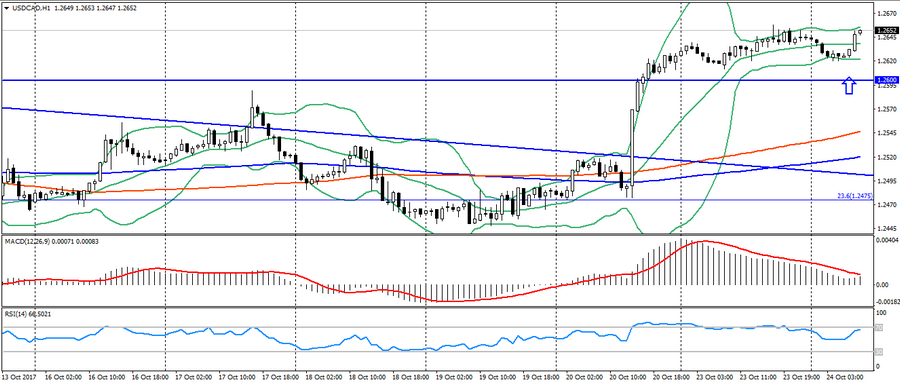
- Support levels: 1.2200, 1.2060 (minimum of 2017), 1.1950 (minimum of 2015).
- Resistence levels: 1.2780 (maximum of August 2017), 1.3000, 1.3160.
- Computer analysis: MACD (signal – downward motion): the indicator is above 0, the signal line has left the body of the histogram. RSI is in the overbought zone. Bollinger Bands (period 20): neutral, growing volatility.
- The main recommendation: sale entry is started from 1.2650, 1.2680, 1.2730 (Fibo. 38.2 from May’s high).
- Alternative recommendation: buy entry is started from 1.2600, 1.2570, 1.2540 (MA 100).
The Canadian dollar is trading lower on the strengthening of the American, continuing to maintain an uptrend.
AUD USD (current price: 0.7790)
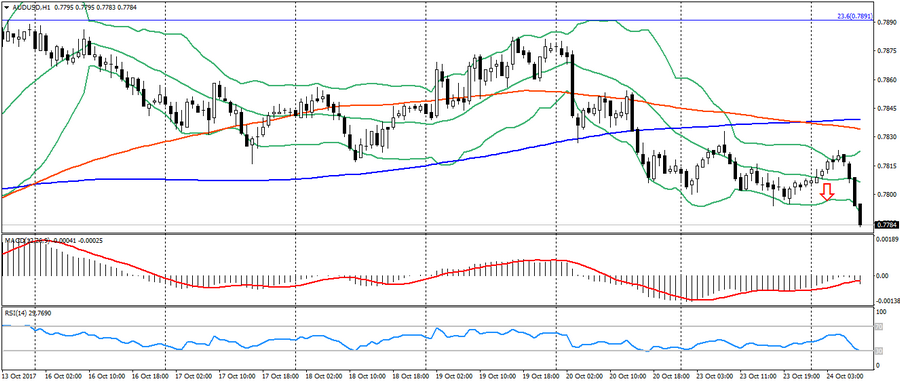
- Support levels: 0.7740, 0.7320 (mionimum of 2017 ), 0.7120.
- Resistence levels: 0.8120 (maximum of 2017 ), 0.8200, 0.8290 (maximum of 2014).
- Computer analysis: MACD (signal – downward motion): the indicator is below 0, the signal line has left the body of the histogram. RSI is in the oversold zone. Bollinger Bands (period 20): oversold, growing volatility.
- The main recommendation: sale entry is started from 0.7820, 0.7840 (MA 200), 0.7860.
- Alternative recommendation: buy entry is started from 0.7800, 0.7770, 0.7750 (Fibo. 38.2 from December 2016 low).
The Australian dollar accelerated the decline based on data on the decline in the cost of raw materials.
NZD USD (current price: 0.6920)
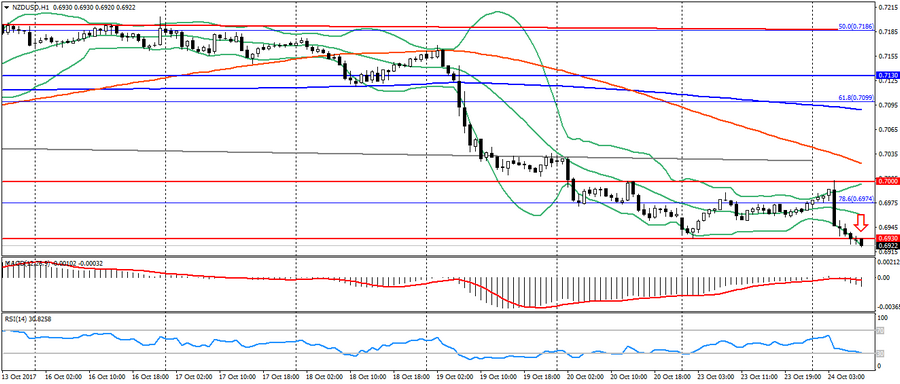
- Support levels: 0.7000, 0.6930, 0.6820 (minimum of the current year).
- Resistence levels: 0.7380, 0.7450, 0.7550 (maximum of 2017 ).
- Computer analysis: MACD (signal – downward motion): the indicator is below 0, the signal line is in the body of the histogram. RSI is in the oversold zone. Bollinger Bands (period 20): overbought, growing volatility.
- The main recommendation: sale entry is started from 0.6950, 0.6980 (Fibо. 78,6 from May’s low), 0.7000.
- Alternative recommendation: buy entry is started from 0.6900, 0.6860, 0.6820.
The New Zealand dollar remains under pressure of political risks in New Zealand and the possibility of reforming the RBNZ.
XAU USD (current price: 1279.00)
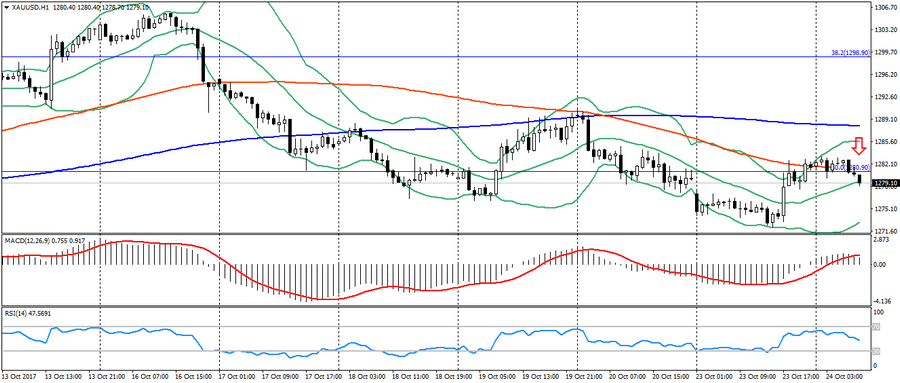
- Support levels: 1250.00, 1226.00, 1200.00.
- Resistence levels: 1340.00, 1355.00, 1374.00 (maximum of 2016 ).
- Computer analysis: MACD (signal – downward motion): the indicator is higher than 0, the signal line has left the body of the histogram. RSI is in the neutral zone. Bollinger Bands (period 20): neutral, declining volatility.
- The main recommendation: sale entry is started from 1287.00 (MA 200), 1290.00, 1295.00.
- Alternative recommendation: buy entry is started from 1277.00, 1272.00, 1267.00.
Gold remains under pressure of the correction of the American, pointing to the possibility of further decline.