
Technical analysis of currency pairs (Anton Hanzenko)
EUR USD (current price: 1.1750)
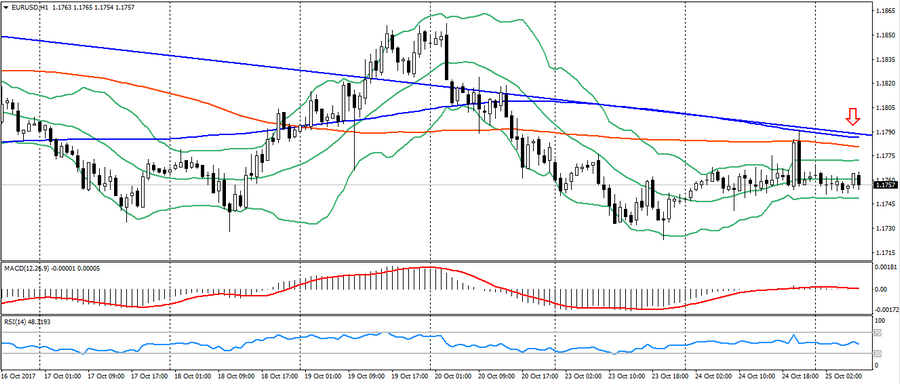
- Support levels: 1.1700 (August 2015 maximum), 1.1600 (2016 maximum), 1.1470.
- Resistance levels: 1.2000, 1.2100, 1.2270 (November 2014 minimum).
- Computer analysis: MACD (signal-flat): indicator is near 0. RSI is in the neutral zone. Bollinger Bands (period 20): neutral, low volatility.
- The main recommendation: sale entry is started from 1.1790 (MA 200), 1.1820, 1.1850 (last week’s high).
- Alternative recommendation: buy entry is started from 1.1730, 1.1700, 1.1680 (Fibo., 23.6 from the low of December last year).
The euro remains to trade in a sideways trend after yesterday’s growth attempts, but is limited by the existing downward trend and the expectation of data on the results of the ECB meeting that will be held tomorrow.
GBP USD (current price: 1.3120)
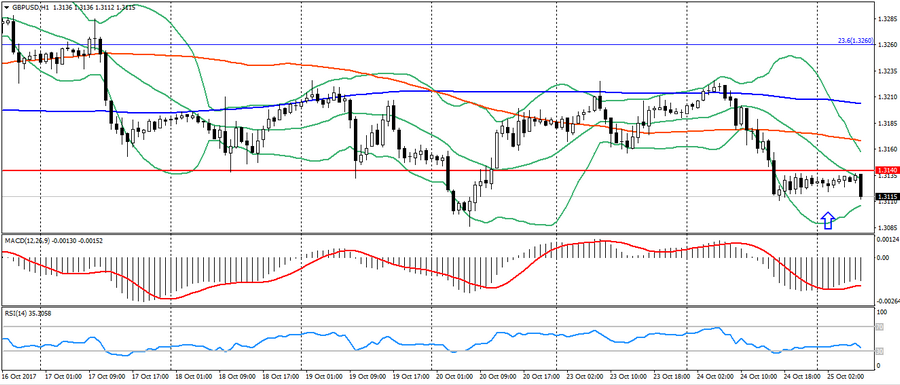
- Support levels: 1.3140, 1.2900, 1.2740 (August 2017 minimum).
- Resistance levels: 1.3500, 1.3660, 1.3830 (February 2016 minimum).
- Computer analysis: MACD (signal – upward motion): the indicator is below 0, the signal line has left the body of the histogram. RSI is in the oversold zone. Bollinger Bands (period 20): neutral, low volatility.
- The main recommendation: sale entry is started from 1.3170 (MA 100), 1.3200 (MA 200), 1.3260 (Fibo 23.6 from January of this year).
- Alternative recommendation: buy entry is started from 1.3110, 1.3090, 1.3020 (Fibo. 38.2 from January of this year).
The British pound also remains to trade near the lows of two weeks after yesterday’s decline. But still remains in a limited sideways trend that is a significant support. Also, do not forget about the upcoming data on the UK, which will have an impact on the dynamics of the pound.
USD CHF (current price: 0.9910)
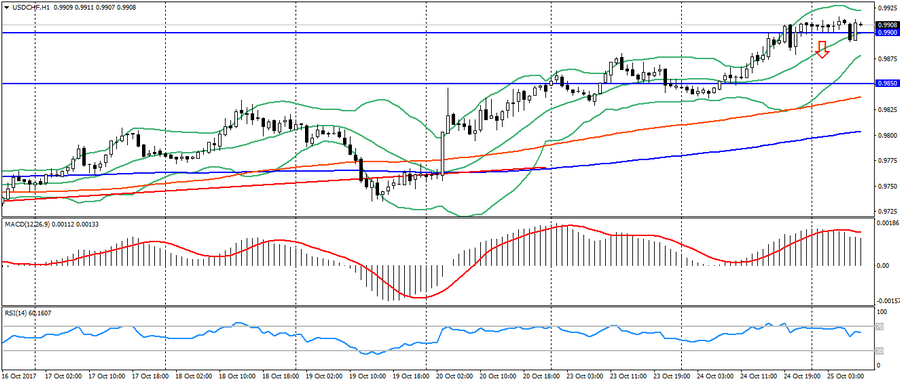
- Support levels: 0.9600, 0.9530, 0.9440 (July 2017 minimum).
- Resistance levels: 0.9850, 0.9900, 1.0000.
- Computer analysis: MACD (signal – downward motion): the indicator is higher than 0, the signal line has left the body of the histogram. RSI is in the neutral zone. Bollinger Bands (period 20): neutral, low volatility.
- The main recommendation: sale entry is started from 0.9900, 0.9930, 0.9960.
- Alternative recommendation: buy entry is started from 0.9850, 0.9780 (MA 100), 0.9710 (MA 200).
The Swiss franc trades downward, remaining under American pressure. But, it is limited to a noticeable overbought and significant resistance levels where a correction can be formed.
USD JPY (current price: 113.80)
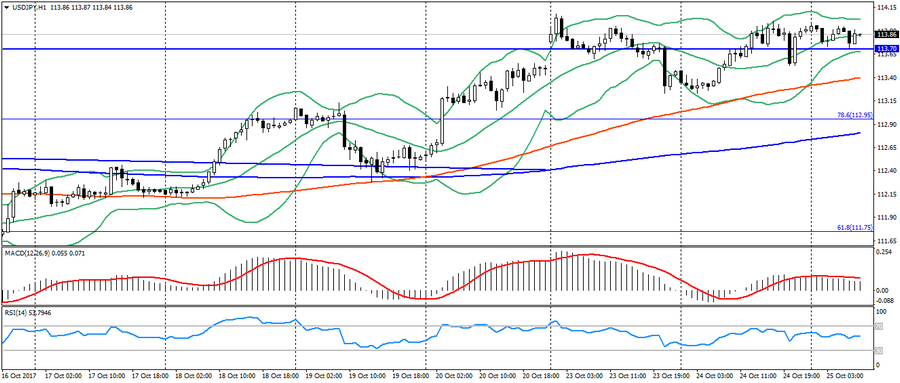
- Support levels: 108.90, 108.10 (April 2017 minimum ), 107.30 ( 2017 minimum).
- Resistance levels: 113.70, 114.50 (July 2017 maximum), 115.00.
- Computer analysis: MACD (signal – downward motion): the indicator is higher than 0, the signal line has left the body of the histogram. RSI is in the neutral zone. Bollinger Bands (period 20): neutral, low volatility.
- The main recommendation: sale entry is started from 114.00 (maximum of the month), 114.20, 114.50.
- Alternative recommendation: buy entry is started from 113.30 (MA 100), 112.90 (Fibo 78.6 from the July’s high), 112.70 (MA 100).
The Japanese yen is trading lower after another weakening, but it also remains near significant resistance levels against the US currency.
USD CAD (current price: 1.2650)
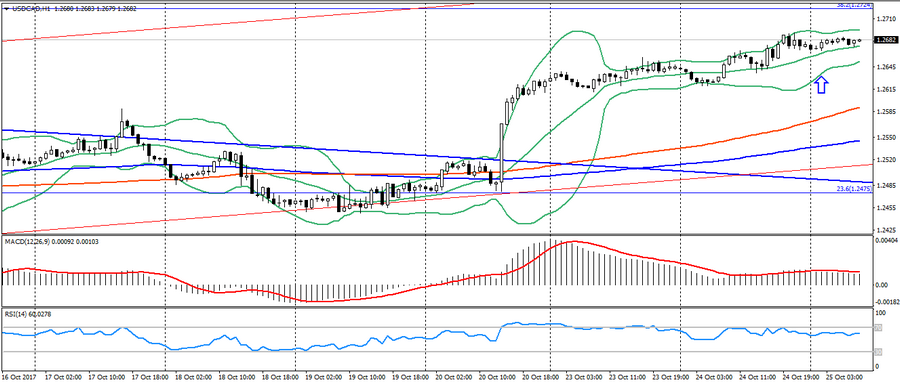
- Support levels: 1.2200, 1.2060 ( 2017), 1.1950 (2015 minimum).
- Resistance levels: 1.2780 (August 2017 maximum), 1.3000, 1.3160.
- Computer analysis: MACD (signal – downward motion): the indicator is higher than 0, the signal line has left the body of the histogram. RSI is in the neutral zone. Bollinger Bands (period 20): neutral, low volatility.
- The main recommendation: sale entry is started from 1.2690, 1.2730 (Fibo, 38.2 from the May’s high), 1.2780.
- Alternative recommendation: buy entry is started from 1.2620, 1.2580, 1.2530 (MA 100).
The Canadian dollar remains to trade in a downtrend against the American, but is also limited to a significant level of 1.2730. Also, today will be publication of the results of the Bank of Canada meeting. This can have a significant impact on the dynamics of the Canadian .
AUD USD (current price: 0.7710)
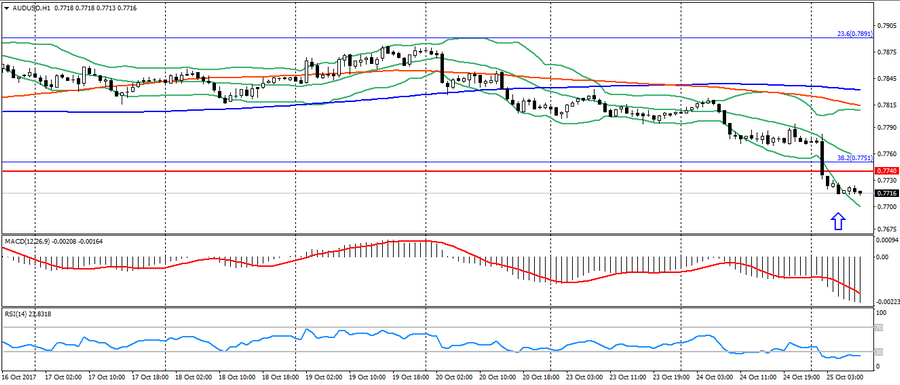
- Support levels: 0.7740, 0.7320 (2017 minimum), 0.7120.
- Resistance levels: 0.8120 (2017 maximum), 0.8200, 0.8290 (2014 maximum).
- Computer analysis: MACD (signal – downward motion): the indicator is below 0, the signal line is in the body of the histogram. RSI is in the oversold zone. Bollinger Bands (period 20): oversold, growing volatility.
- The main recommendation: sale entry is started from 0.7750 (Fibo, 38.2 from December 2016), 0.7820 (MA 100), 0.7880 (MA 200).
- Alternative recommendation: buy entry is started from 0.7690 (MA 200 to D1), 0.7650, 0.7630 (Fibo 50.0 from the low of December 2016).
The Australian dollar remains under pressure based on the flat data on inflation in Australia. But, it is also worth noting that the further decline of the pair is limited to psychology 0.7700.
NZD USD (current price: 0.6900)
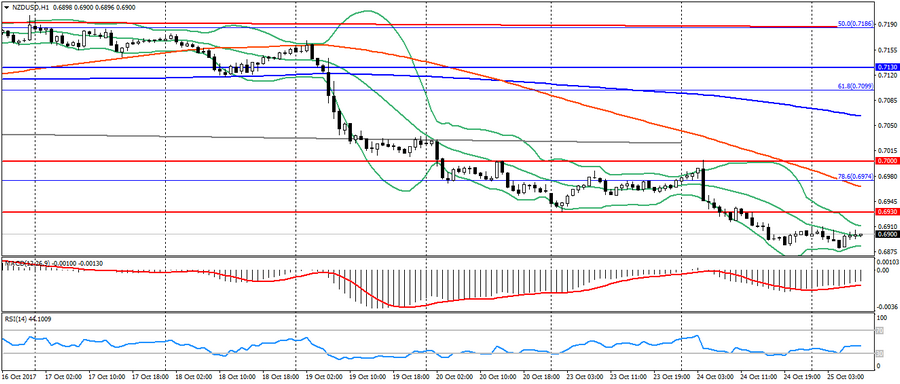
- Support levels: 0.7000, 0.6930, 0.6820 (the minimum of the current year).
- Resistance levels: 0.7380, 0.7450, 0.7550 (2017 maximum).
- Computer analysis: MACD (signal – upward motion): the indicator is below 0, the signal line has left the body of the histogram. RSI is in the neutral zone. Bollinger Bands (period 20): neutral, low volatility.
- The main recommendation: sale entry is started from 0.6930, 0.6980 (Fibo, 78.6 from the May’s low), 0.7000.
- Alternative recommendation: buy entry is started from 0.6870, 0.6850, 0.6820.
The New Zealand dollar remains near the significant psychology 0.6900 and correction is possible.
XAU USD (current price: 1273.00)
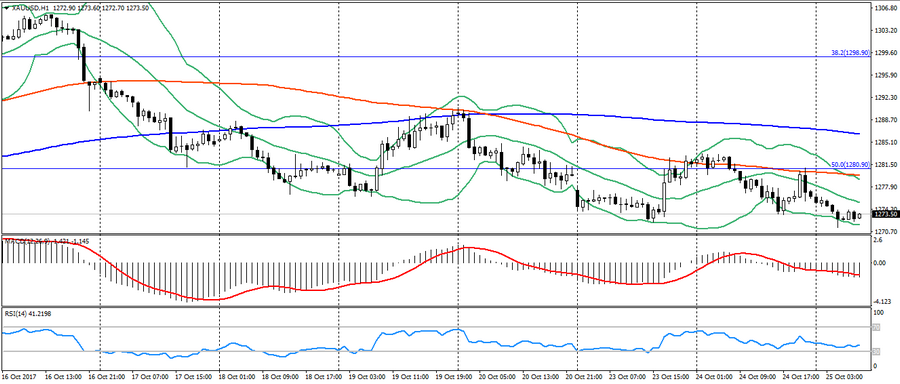
- Support levels: 1250.00, 1226.00, 1200.00.
- Resistance levels: 1340.00, 1355.00, 1374.00 (2016 maximum).
- Computer analysis: MACD (signal – downward motion): the indicator is below 0, the signal line is in the body of the histogram. RSI is in the neutral zone. Bollinger Bands (period 20): neutral, declining volatility.
- The main recommendation: sale entry is started from 1277.00 (MA 200), 1280.00 (Fibo.50.0 from the July’s low), 1286.00 (MA 200).
- Alternative recommendation: buy entry is started from 1270.00, 1267.00, 1262.00 (Fibo 61.8 from the July’s low).
Gold remains under pressure on the correction of the American, but noticeably slowed down the decline.