
Technical analysis of currency pairs (Anton Hanzenko)
EUR USD (current price: 1.1820)
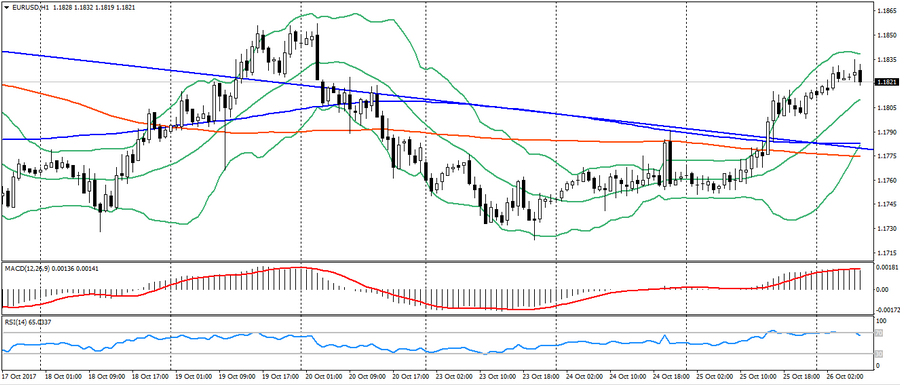
- Support levels: 1.1700 (maximum of August 2015), 1.1600(maximum of 2016), 1.1470.
- Resistence levels: 1.2000, 1.2100, 1.2270 (minimum of 2014).
- Computer analysis: MACD (signal – upward motion): the indicator is above 0, the signal line in the body of the histogram. RSI is in the overbought zone. Bollinger Bands (period 20): neutral, declining volatility.
- The main recommendation: sale entry is started from 1.1850 (maximum of the last week), 1.1880, 1.1900 (strong psychology).
- Alternative recommendation: buy entry is started from 1.1800, 1.1780 (MA 200), 1.1750.
The euro remains to trade with strengthening on the correction of positions before the ECB meeting. Also, the single currency remains in a significant overbought, which can cause a decline. Do not forget that today will be a report by the ECB, which will have a significant impact on the market.
GBP USD (current price: 1.3250)
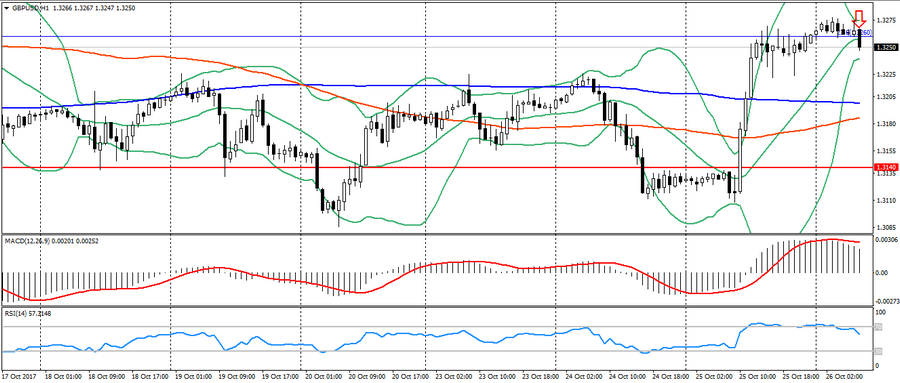
- Support levels: 1.3140, 1.2900, 1.2740 (minimum of August 2017).
- Resistence levels: 1.3500, 1.3660, 1.3830(minimum of February 2016).
- Computer analysis: MACD (signal – downward motion): the indicator is higher than 0, the signal line has left the body of the histogram. RSI is in the neutral zone. Bollinger Bands (period 20): neutral, low volatility.
- The main recommendation: sale entry is started from 1.3300 (MA 200 at H4), 1.3330 (a maximum of three weeks), 1.3360 (maximum of October).
- Alternative recommendation: buy entry is started from 1.3220, 1.3190 (MA 200), 1.3140.
The British pound also remains trading near the highs of the week after yesterday’s growth. Given overbought this pair, it is possible to form a correction from the level of 1.3260.
USD CHF (current price: 0.9880)
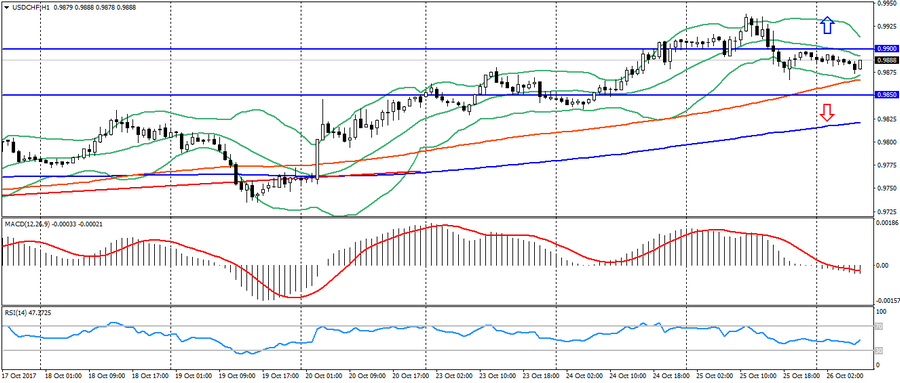
- Support levels: 0.9600, 0.9530, 0.9440 (minimum of July 2017).
- Resistence levels: 0.9850, 0.9900, 1.0000.
- Computer analysis: MACD (signal – downward motion): the indicator is below 0, the signal line in the body of the histogram. RSI is in the neutral zone. Bollinger Bands (period 20): neutral, declining volatility.
- The main recommendation: sale entry is started from 0.9900, 0.9940 (maximum of the last five months), 0.9960.
- Alternative recommendation: buy entry is started from 0.9850, 0.9820, 0.9780 (MA 100).
The Swiss frank remains to trade at the opening of the day, while maintaining the potential for growth, but limited to resistance levels.
USD JPY (current price: 113.60)
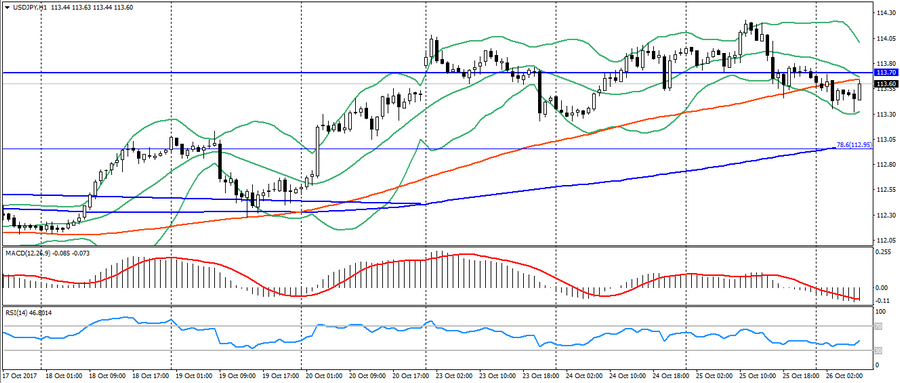
- Support levels: 108.90, 108.10 (minimum of April 2017), 107.30 (minimum of 2017).
- Resistence levels: 113.70, 114.50 (maximum of July 2017), 115.00.
- Computer analysis: MACD (signal – downward motion): the indicator is below 0, the signal line in the body of the histogram. RSI is in the neutral zone. Bollinger Bands (period 20): neutral, declining volatility.
- The main recommendation: sale entry is started from 113.70, 113.90, 114.20 (local maximum).
- Alternative recommendation: buy entry is started from 113.20, 112.90 (Фибо. 78.6 от максимума июля), 112.70 (MA 100).
The Japanese yen is trading with a small strengthening at the beginning of the day on the growth of pessimism, but is limited to an uptrend in the pair.
USD CAD (current price: 1.2790)
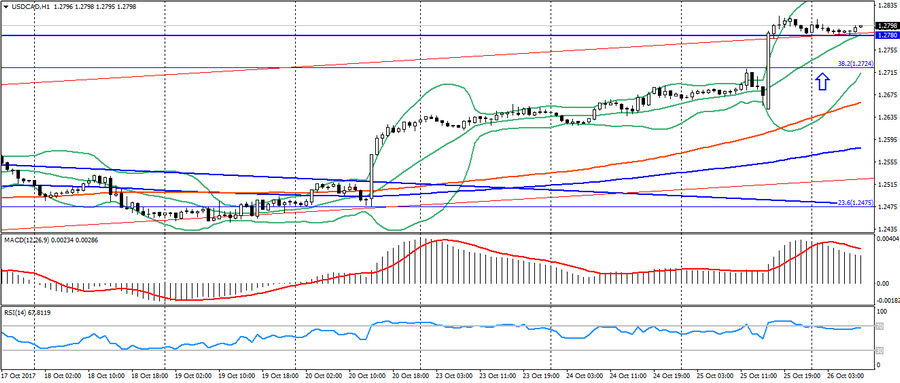
- Support levels: 1.2200, 1.2060 (minimum of 2017), 1.1950 (minimum of 2015).
- Resistence levels: 1.2780 (maximum of August 2017), 1.3000, 1.3160.
- Computer analysis: MACD (signal – downward motion): the indicator is higher than 0, the signal line has left the body of the histogram. RSI is in the neutral zone. Bollinger Bands (period 20): neutral, declining volatility.
- The main recommendation: sale entry is started from 1.2820, 1.2870, 1.2920 (Fibo. 50.0 from the May’s high).
- Alternative recommendation: buy entry is started from 1.2750, 1.2720, 1.2650 (MA 100).
The Canadian dollar remains trading at the opening of the day after yesterday’s decline. The Canadian retains the potential to decline, but is limited to oversold.
AUD USD (current price: 0.7700)
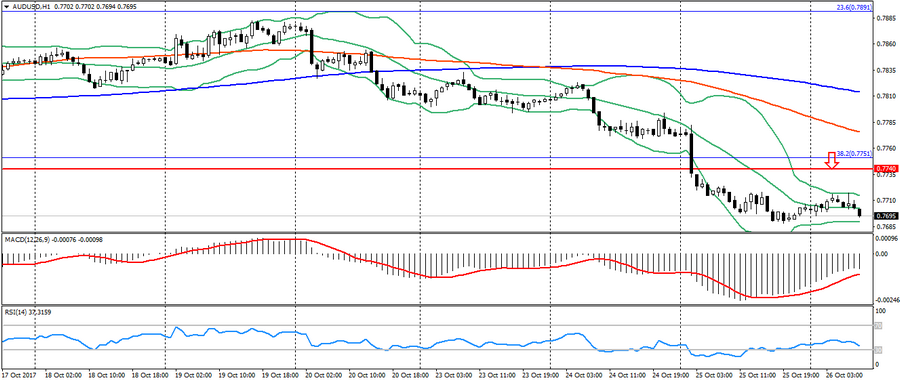
- Support levels: 0.7740, 0.7320 (minimum of 2017), 0.7120.
- Resistence levels: 0.8120 (maximum of 2017 ), 0.8200, 0.8290 (maximum of 2014).
- Computer analysis: MACD (signal – upward motion): the indicator is below 0, the signal line has left the body of the histogram. RSI is in the oversold zone. Bollinger Bands (period 20): neutral, low volatility.
- The main recommendation: sale entry is started from 0.7720, 0.7750 (Фибо. 38.2 от декабря 2016 года), 0.7780 (MA 100).
- Alternative recommendation: buy entry is started from 0.7690 (MA 200 at D1), 0.7650, 0.7630 (Fibo. 50.0 from the low of December 2016).
The Australian dollar remains trading near the monthly lows to maintain the downtrend.
NZD USD (current price: 0.6870)
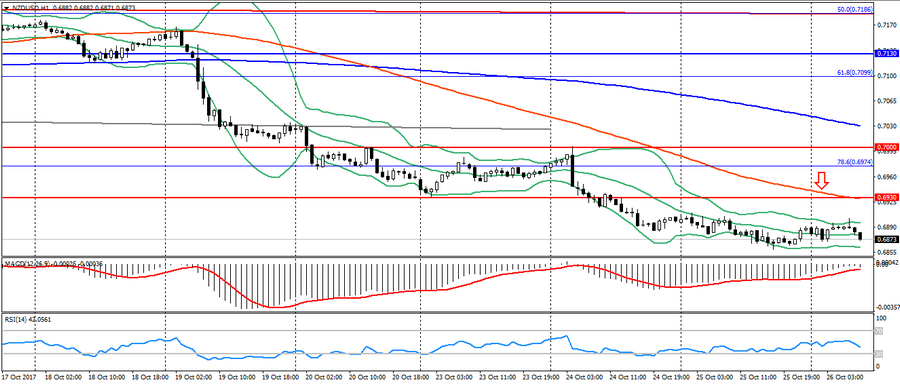
- Support levels: 0.7000, 0.6930, 0.6820 (minimum of the current year).
- Resistence levels: 0.7380, 0.7450, 0.7550 (maximum of 2017).
- Computer analysis: MACD (signal – upward motion): the indicator is below 0, the signal line has left the body of the histogram. RSI is in the neutral zone. Bollinger Bands (period 20): neutral, low volatility.
- The main recommendation: sale entry is started from 0.6930, 0.6980 (Фибо. 78,6 от минимума мая), 0.7000.
- Alternative recommendation: buy entry is started from 0.6860, 0.6840, 0.6820.
The New Zealand Dollar remains in a downward trend, keeping the potential for a decrease.
XAU USD (current price: 1279.00)
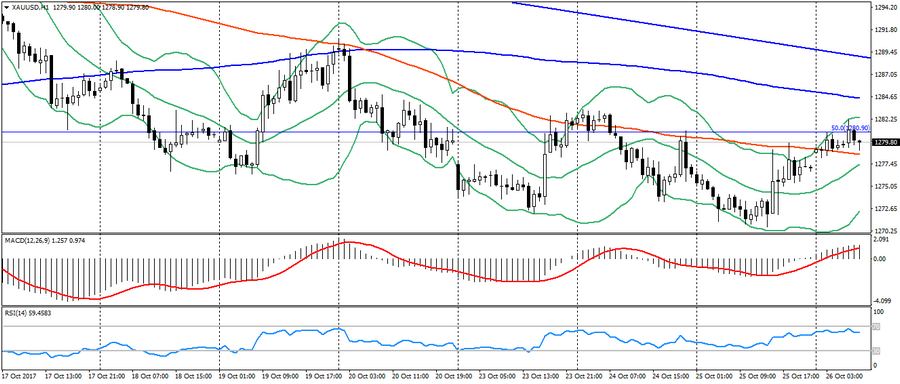
- Support levels: 1250.00, 1226.00, 1200.00.
- Resistence levels: 1340.00, 1355.00, 1374.00 (maximum of 2016 ).
- Computer analysis: MACD (signal – upward motion): the indicator is above 0, the signal line is in the body of the histogram. RSI is in the neutral zone. Bollinger Bands (period 20): neutral, declining volatility.
- The main recommendation: sale entry is started from 1284.00 (MA 200), 1287.00, 1291.00.
- Alternative recommendation: buy entry is started from 1277.00, 1273.00, 1270.00.
Gold strengthened early in the day on the flight from risks, but still maintains a downward trend.