
US GDP preliminary data
- GDP (q / q) (Q2), fact 4.2%, forecast 4.0%.
- GDP deflator (q / q) (Q2), fact 3.2%, forecast 3.0%.
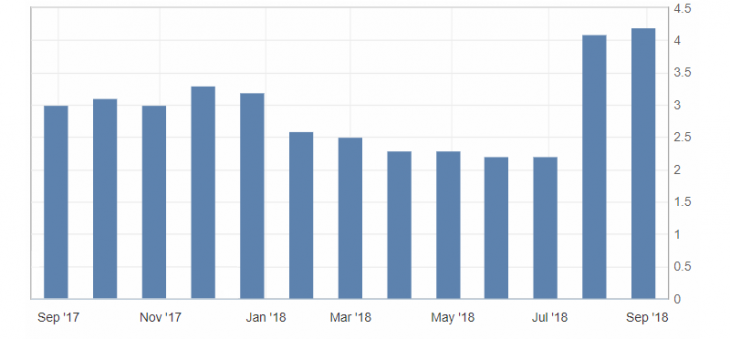
US Preliminary GDP chart
Data on US GDP preliminary indicators continue to be revised upwards for the second month in a row, indicating a noticeable growth of this indicator after a decline in the first quarter to around 2.0%. At the same time, GDP growth, even by 1%, will indicate a significant growth in the US economy.
The news on the background of the restrained growth of the dollar is very positive and can strengthen the correction movement in the dollar. On the other hand, the 95.00 mark continues to be a significant resistance for the US dollar index, close to it the dollar may slow down under these conditions.
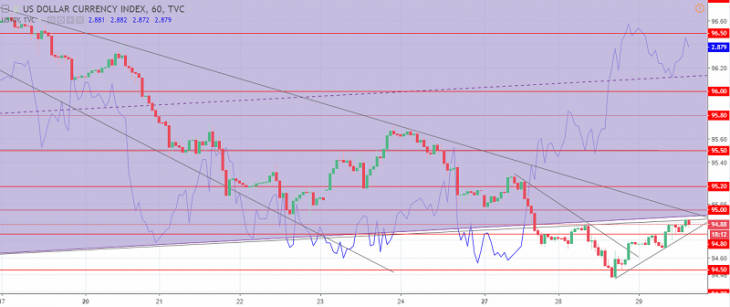
The US dollar index chart. The current price is 94.90 (10-year government bonds yield is a blue line)
Read also: “Economy of Switzerland. How much is the lowest discount rate in the world”
Hanzenko Anton
Earn with the help of the trade service on the news Erste News!
Topical articles of the trader’s blog:
- Stock indices of America: Canada, Mexico and Brazil
- Trade balance influence on the country’s economy
- Stock indices : Asia-Pacific region
Current Investment ideas: