
Technical Analysis of Oil (Alexander Sivtsov)
Oil shows negative dynamics during the Asian session.
Brent chart (current price: $ 67.86)
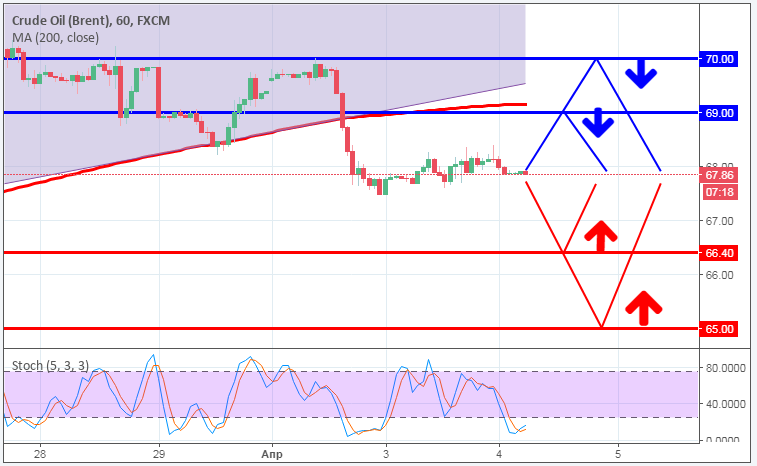
The Brent is traded below the zero mark during the Asian session.
- Resistance 1: From $ 69.00 (psychological level)
- Resistance 2: From $ 70.00 (psychological level)
- Support 1: From $ 66.40 (technical level)
- Support 2: From $ 65.00 (psychological level)
Computer analysis: The Stochastic Oscillator movings on the H1 chart indicate oversold of the instrument, against which the Brent price may recover.
WTI chart (current price: $ 63.28)
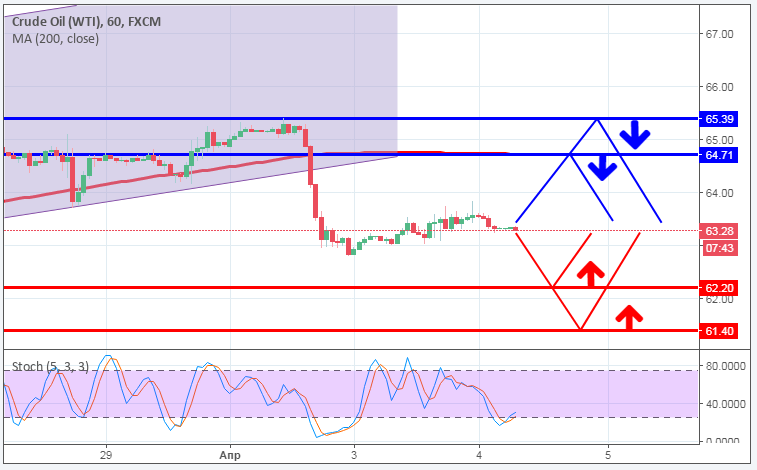
The WTI brand is traded with a small minus during the Asian session.
- Resistance 1: From $ 64.71 (MA 200 on H1)
- Resistance 2: From $ 65.39 (April 2 maximum)
- Support 1: From $ 62.20 (technical level)
- Support 2: From $ 61.40 (technical level)
Computer analysis: The Stochastic Oscillator movings on the chart H1 indicate the oversold of the instrument, in connection with which the increase in the price of WTI is expected.