
Technical Analysis of Oil (Alexander Sivtsov)
Oil is traded above the zero mark in the Asian session.
Brent chart (current price: $ 70.22)
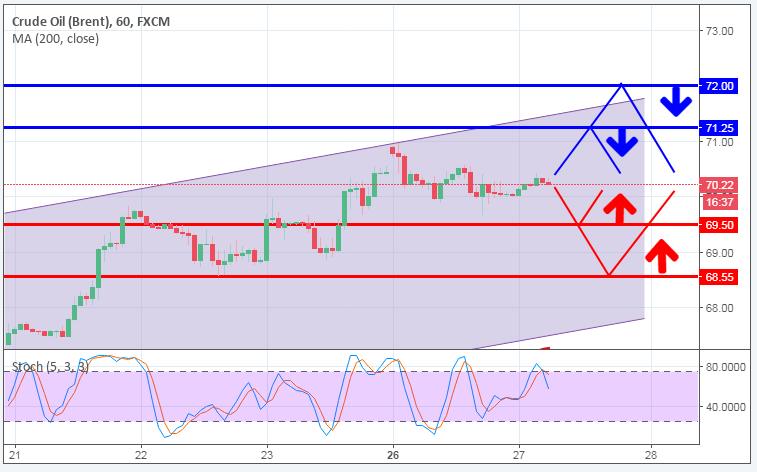
The Brent is traded above the zero mark during the Asian session.
Resistance 1: From $ 71.25 (2018 maximum)
Resistance 2: From $ 72.00 (psychological level)
Support 1: From $ 69.50 (technical level)
Support 2: From $ 68.55 (March 22 minimum)
Computer analysis: The Stochastic Oscillator movings on the H1 chart indicate overbought of the instrument, against which the reduction of the Brent price is possible.
WTI chart(current price: $ 65.75)
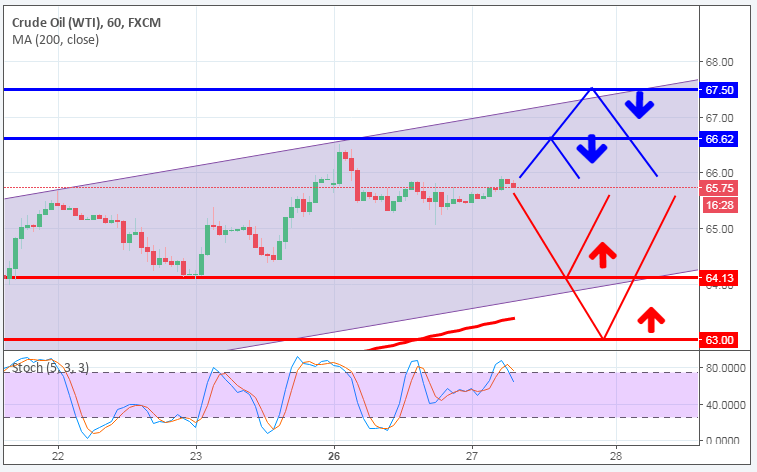
The WTI is traded with a plus during the Asian session.
Resistance 1: From $ 66.62 (2018 maximum)
Resistance 2: From $ 67.50 (technical level)
Support 1: From $ 64.13 (March 22 minimum)
Support 2: From $ 63.00 (psychological level)
Computer analysis: The Stochastic Oscillator movings on the H1 chart indicate overbought of the instrument, in connection with which one should expect a certain reduction in the price of WTI.