
Technical Analysis of Oil (Alexander Sivtsov)
Oil shows a positive trend during the Asian session.
Brent chart (current price: $ 67.69)
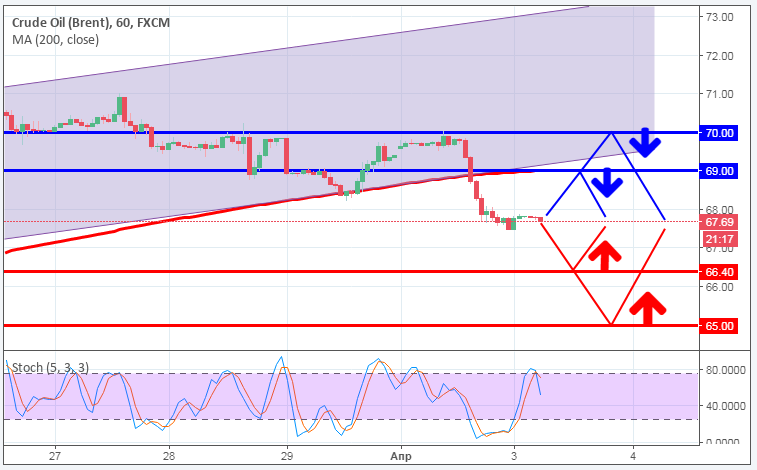
The Brent brand is traded above the zero mark during the Asian session.
- Resistance 1: From $ 69.00 (psychological level)
- Resistance 2: From $ 70.00 (psychological level)
- Support 1: From $ 66.40 (technical level)
- Support 2: From $ 65.00 (psychological level)
Computer analysis: The Stochastic Oscillator movings on the chart H1 are in the neutral zone, against which Brent price movement in a narrow range is possible.
WTI chart (current price: $ 63.04)
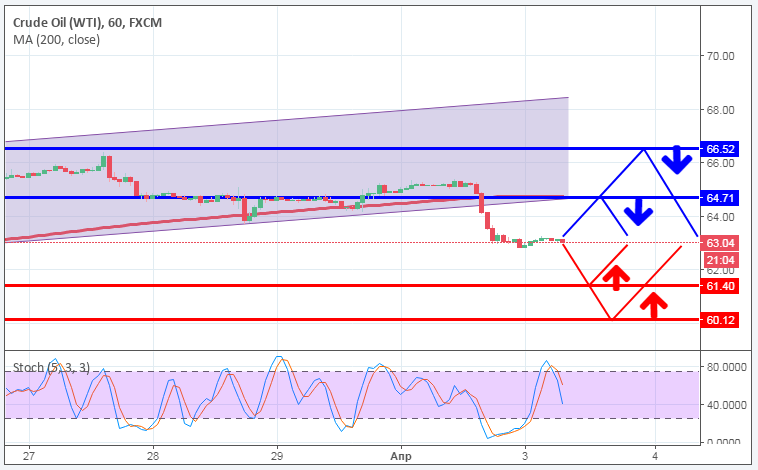
The WTI brand is traded with a small plus during the Asian session.
- Resistance 1: From $ 64.71 (MA 200 on H1)
- Resistance 2: From $ 66.52 (March 26 maximum)
- Support 1: From $ 61.40 (technical level)
- Support 2: From $ 60.12 (March 14 minimum)
Computer analysis: The Stochastic Oscillator movings on the H1 chart are in the neutral zone, so one should expect the consolidation of the WTI price.