
Technical Analysis of Oil (Alexander Sivtsov)
Oil is traded above the zero mark during the Asian session.
The Brent graph (current price: $ 67.57)
The Brent brand is traded above the zero mark during the Asian session.
- Resistance 1: From $ 68.40 (technical level)
- Resistance 2: From $ 69.00 (psychological level)
- Support 1: From $ 66.42 (March 16 maximum)
- Support 2: From $ 65.30 (MA 200 on H1)
Computer analysis: The Stochastic Oscillator movings on the H1 chart are in the oversold zone, against which the continuation of the growth of the Brent price in the second half of the trades is possible.
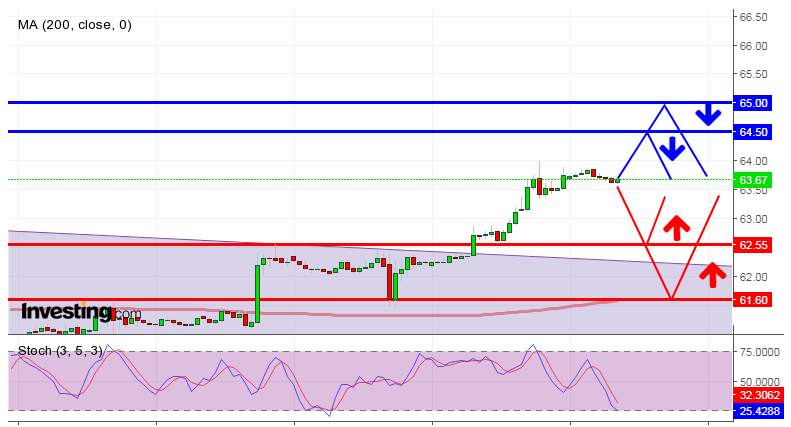
The WTI graph (current price: $ 63.67)

The WTI is traded with a plus during the Asian session.
- Resistance 1: From $ 64.50 (technical level)
- Resistance 2: From $ 65.00 (psychological level)
- Support 1: From $ 62.55 (March 16 maximum)
- Support 2: From $ 61.60 (MA 200 on H1)
Computer analysis: the Stochastic Oscillator movings on the H1 chart are in the oversold zone, in connection with which one should expect the renewal of the WTI price growth in the second half of the trades.