
Technical Analysis of Oil (Alexander Sivtsov)
Oil is traded above the zero mark in the Asian session.
The Brent graph (current price: $ 6447.60 per 100 barrels)
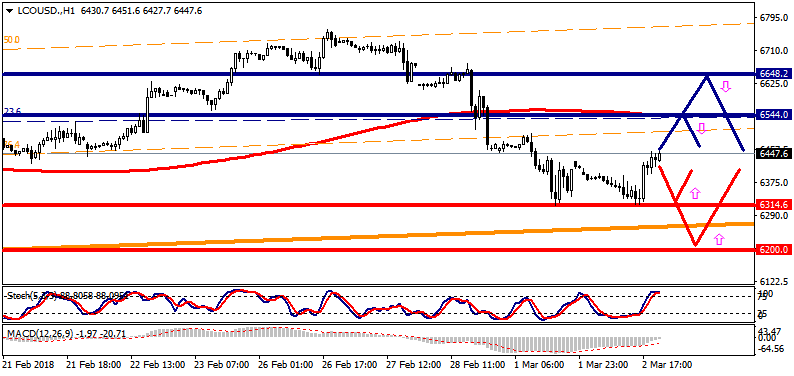
The Brent is traded above the zero mark during the Asian session.
- Resistance 1: With $ 6544.00 (MA 200 per H1)
- Resistance 2: From $ 6648.20 (minimum of February 26)
- Support 1: From $ 6314.60 (March 1 minimum)
- Support 2: From $ 6200.00 (psychological level)
Computer analysis: The Stochastic Oscillator movings on the N4 chart are in the neutral zone, the consolidation of the Brent price can be formed.
The WTI graph (current price: $ 6132.10 per 100 barrels)
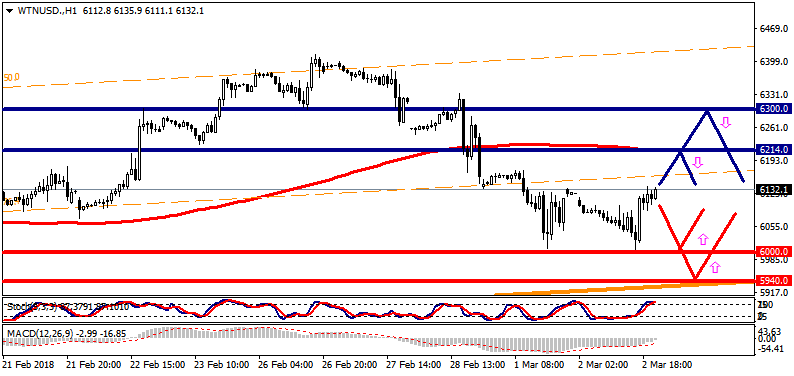
The WTI brand is traded with a small plus during the Asian session.
- Resistance 1: From $ 6214.00 (MA 200 on H1)
- Resistance 2: From $ 6300.00 (psychological level)
- Support 1: From $ 6000.00 (psychological level)
- Support 2: With $ 5940.00 (support line of the Up channel on H4)
Computer analysis: The Stochastic Oscillator movings on the H4 chart are in the neutral zone, one should expect the WTI price movement in a narrow range.