
Technical Analysis of Oil (Alexander Sivtsov)
Oil is traded below the zero mark in the Asian session.
The Brent graph (current price: $ 6626.40 per 100 barrels)
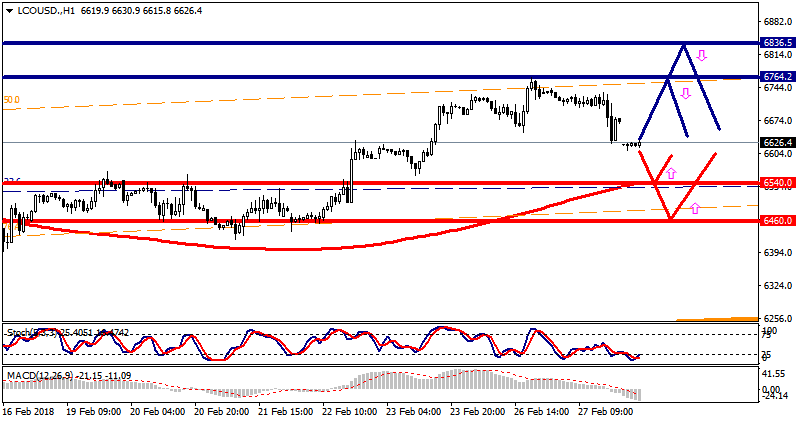
The Brent brand is traded with a minus during the Asian session.
- Resistance 1: From $ 6764.20 (February 26 maximum)
- Resistance 2: From $ 6836.50 (February 5 maximum)
- Support 1: From $ 6540.00 (MA 200 on H1)
- Support 2: From $ 6460.00 (technical level)
Computer analysis: The Stochastic Oscillator movings on the N1 chart indicate the oversold of the instrument, against which the Brent price may recover.
The WTI graph (current price: $ 6264.60 per 100 barrels)
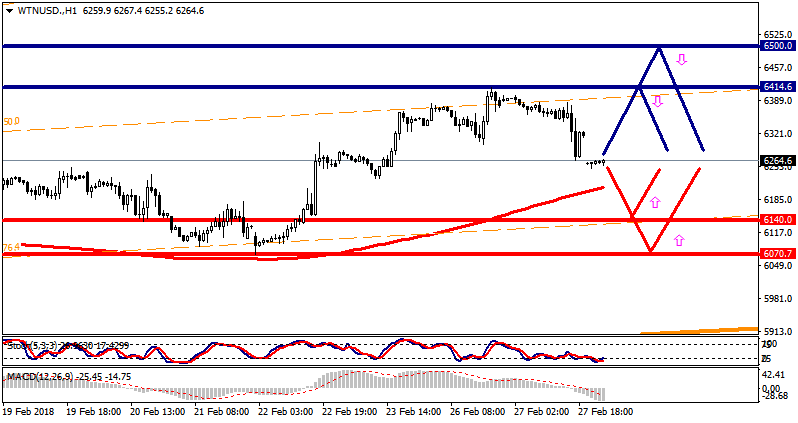
The WTI brand is traded below the zero mark during the Asian session.
- Resistance 1: From $ 6414.60 (February 26 maximum)
- Resistance 2: From $ 6500.00 (psychological level)
- Support 1: From $ 6140.00 (technical level)
- Support 2: From $ 6,070.70 (February 22 minimum)
Computer analysis: The Stochastic Oscillator movings on the chart H1 indicate the oversold of the instrument, the recovery of the WTI price is possible.