
Technical Analysis of Oil (Alexander Sivtsov)
Oil is traded below the zero mark in the Asian session.
The Brent graph (current price: $ 6531.30 per 100 barrels)
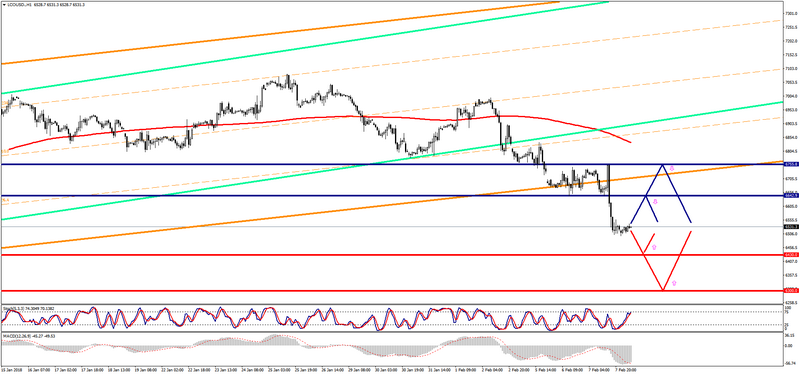
The Brent brand is traded near the zero mark during the Asian session.
- Resistance 1: From $ 6642.90 (February 6 minimum)
- Resistance 2: From $ 6755.80 (February 6 maximum)
- Support 1: From $ 6430.00 (technical level)
- Support 2: From $ 6300.00 (psychological level)
Computer analysis: The Stochastic Oscillator movings on the H4 chart indicate the oversold of the instrument, the Brent price may recover.
The WTI graph (current price: $ 6139.60 per 100 barrels)
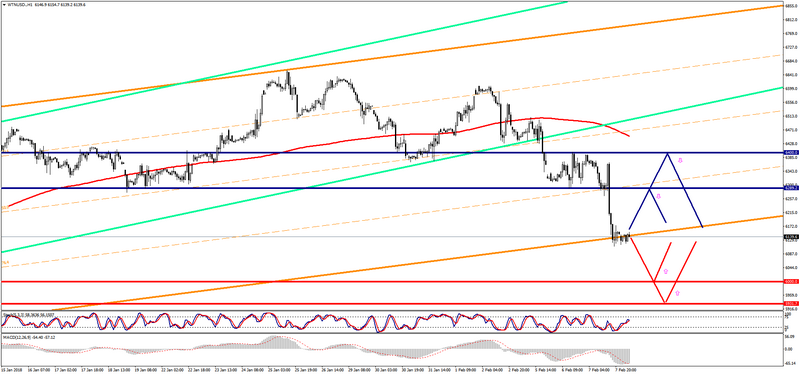
The WTI brand is traded with a small minus during the Asian session.
- Resistance 1: From $ 6289.20 (February 6 minimum)
- Resistance 2: From $ 6400.00 (psychological level)
- Support 1: From $ 6000.00 (psychological level)
- Support 2: From $ 5931.10 (December 27 minimum)
Computer analysis: The Stochastic Oscillator movings on the H4 chart indicate the oversold of the instrument, one should expect some recovery in the price of WTI.