
Technical Analysis of Oil (Alexander Sivtsov)
Oil is declining during the Asian session.
The Brent graph (current price: $ 6682.40 per 100 barrels)
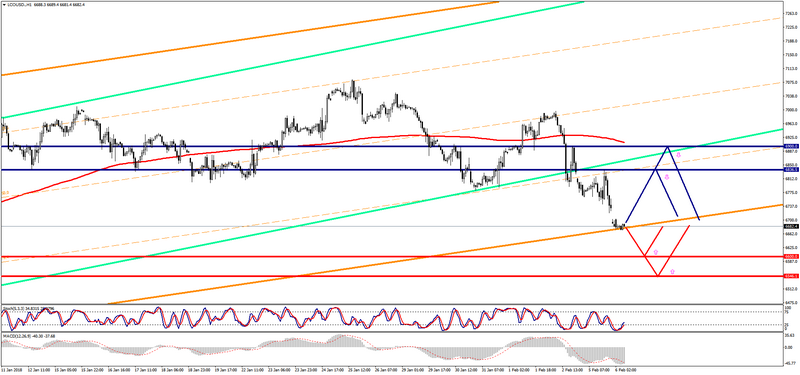
The Brent brand is traded with a minus during the Asian session.
- Resistance 1: From $ 6836.50 (February 5 maximum)
- Resistance 2: From $ 6900.00 (psychological level)
- Support 1: From $ 6600.00 (psychological level)
- Support 2: From $ 6546.10 (January 25 minimum)
Computer analysis: The Stochastic Oscillator movings on the chart of H4 indicate the oversold of the instrument. That is why there may be some recovery in the price of Brent.
The WTI graph (current price: $ 6324.30 per 100 barrels)
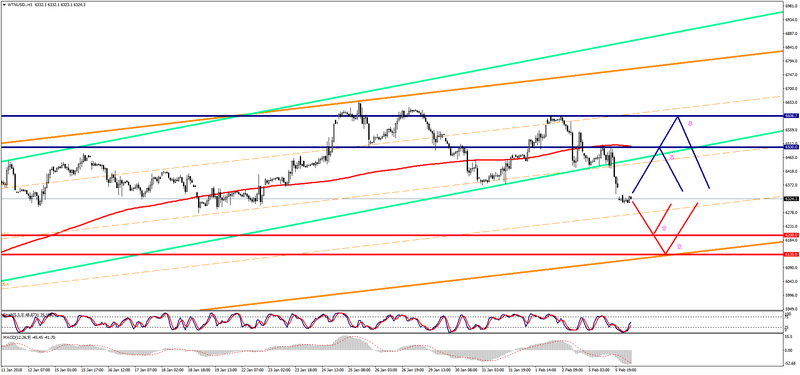
The WTI brand is traded below the zero mark during the Asian session.
- Resistance 1: From $ 6500.00 (psychological level)
- Resistance 2: From $ 6606.70 (February 2 maximum)
- Support 1: From $ 6200.00 (psychological level)
- Support 2: With $ 6,135.00 (Support line of Up Channel on H4)
Computer analysis: The Stochastic Oscillator movings on the chart of H4 indicate the oversold of the instrument. That is why one should expect some growth in the WTI price.