
Technical Analysis of Oil (Alexander Sivtsov)
Oil is traded slightly above the zero mark during the Asian session.
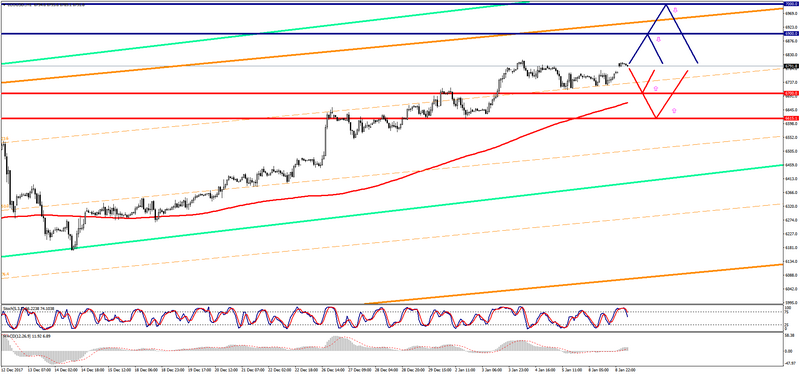
The Brent graph (current price: $ 6791.80 per 100 barrels)
The Bent brand is traded slightly above the zero mark during the Asian session.
- Resistance 1: From $ 6900.00 (psychological level)
- Resistance 2: From $ 7000.00 (psychological level)
- Support 1: From $ 6700.00 (psychological level)
- Support 2: From $ 6615.10 (January 2 minimum)
Computer analysis: The Stochastic Oscillator movings on the charts of H1 and H4 indicate overbought of the instrument, so there may be a slight decrease in the Brent price.
The WTI graph (current price: $ 6209.70 per 100 barrels)
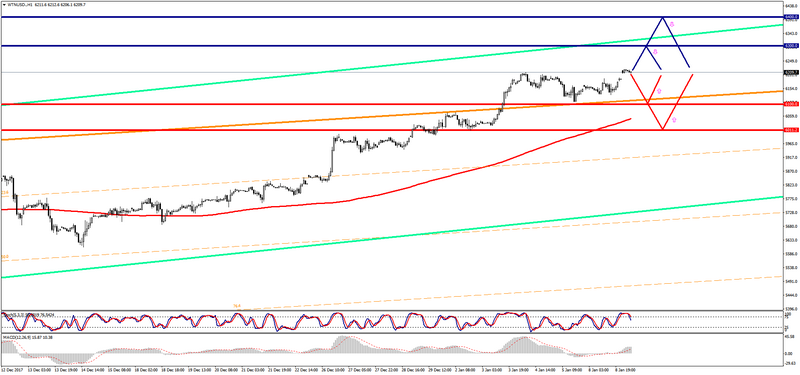
The WTI brand is traded with a plus during the Asian session.
- Resistance 1: From $ 6300.00 (psychological level)
- Resistance 2: From $ 6400.00 (psychological level)
- Support 1: From $ 6100.00 (psychological level)
- Support 2: From $ 6011.20 (January 2 minimum)
Computer analysis: The Stochastic Oscillator movings on the H1 and H4 charts indicate overbought of the instrument, which is why one should expect a certain reduction in the WTI price in anticipation of data on oil reserves in the US.