
Technical analysis of gold and silver (Alexander Sivtsov)
Gold chart (current price: $ 1341.70)
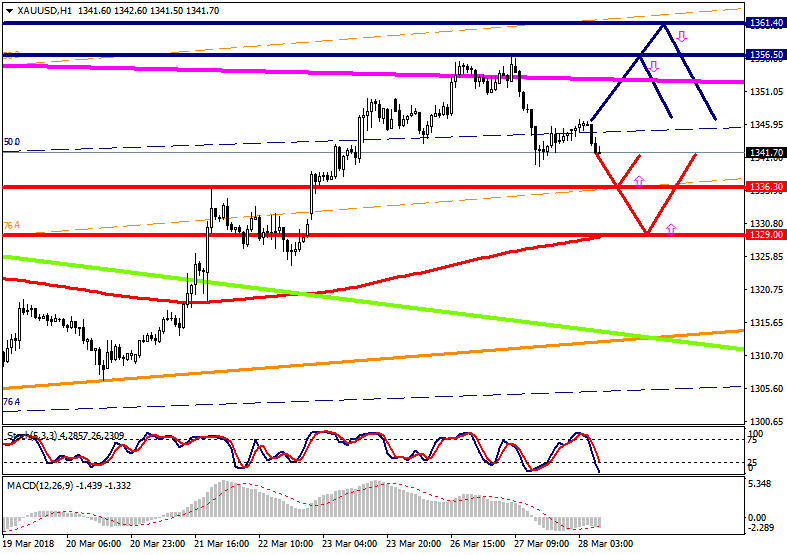
Gold is traded near the zero mark during the Asian session.
- Resistance 1: From $ 1356.50 (March 27 maximum)
- Resistance 2: From $ 1361.40 (February 16 maximum)
- Support 1: From $ 1336.30 (March 26 maximum)
- Support 2: From $ 1329.00 (MA 200 on H1)
Computer analysis: The Stochastic Oscillator movings on the chart H1 are included in the oversold zone, against which one should expect a recovery in the price of gold.
Silver chart (current price: $ 16.47)
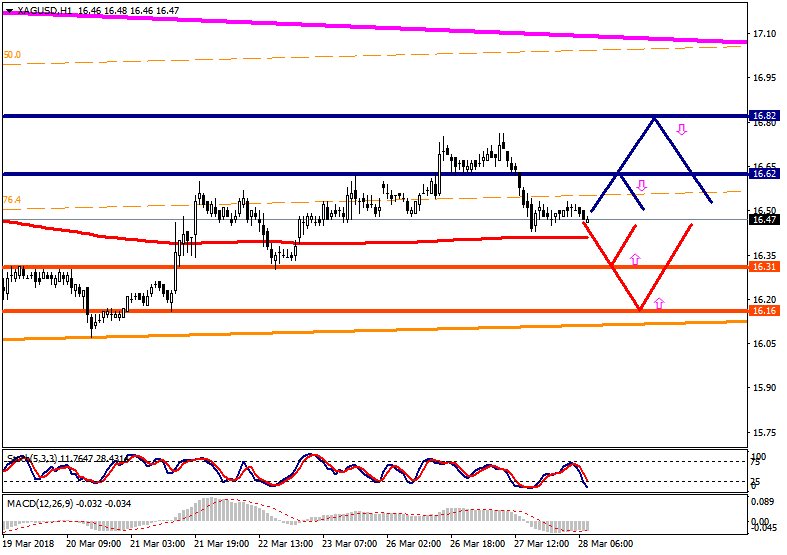
Silver is traded with a small minus during the Asian session.
- Resistance 1: From $ 16.62 (technical level)
- Resistance 2: From $ 16.82 (March 6 maximum)
- Support 1: From $ 16.31 (technical level)
- Support 2: From $ 16.16 (technical level)
Computer analysis: The Stochastic Oscillator movings on the chart H1 is included in the oversold zone, against the background of which the recovery of the growth in the price of silver is possible.