
Technical analysis of gold and silver (Alexander Sivtsov)
Gold chart (current price: $ 1319.00)
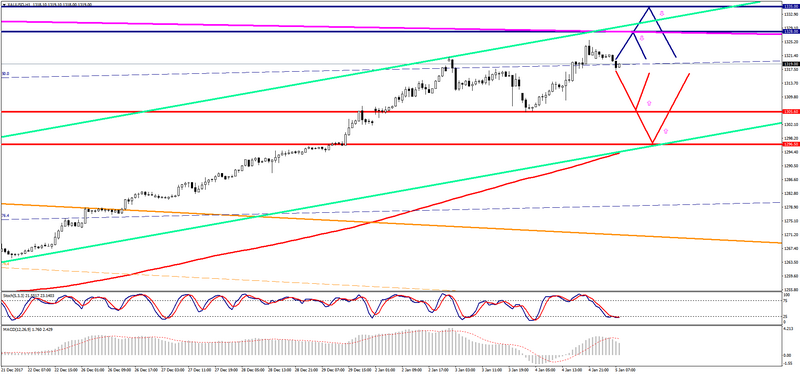
Gold is traded below the zero mark during the Asian session.
- Resistance 1: From $ 1328.00 (resistance line of Low channel on W1)
- Resistance 2: From $ 1335.00 (technical level)
- Support 1: From $ 1305.60 (January 4 minimum)
- Support 2: From $ 1296.50 (support line of Up Channel on H1)
Computer analysis: The Stochastic Oscillator movings on the chart H1 indicate the oversold of the instrument, the continuation of the growth of the gold price is possible.
Silver chart (current price: $ 17.13)
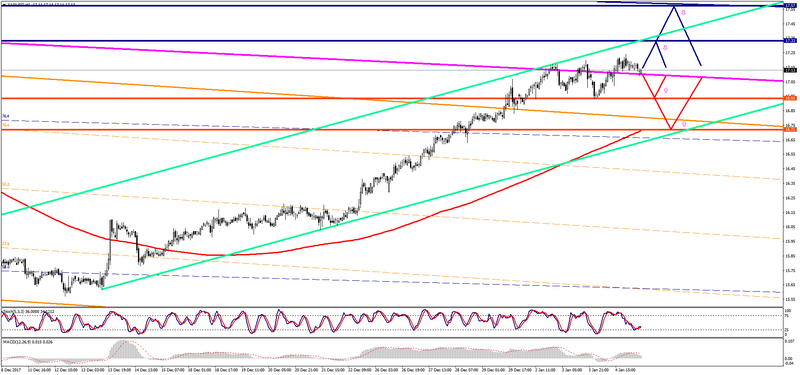
Silver is traded below the zero mark during the Asian session.
- Resistance 1: From $ 17.33 (November 17 maximum)
- Resistance 2: From $ 17.57 (resistance line of Low channel on D1)
- Support 1: From $ 16.93 (January 4 minimum)
- Support 2: From $ 16.72 (MA 200 on H1)
Computer analysis: The Stochastic Oscillator movings on the chart H1 are in the neutral zone, so that the consolidation of the price of silver is possible.