
Data on durable goods orders in the US
- Core durable goods orders (m / m) (July), fact 0.2%, forecast 0.5%.
- Durable goods orders (m / m) (July), fact -1.7%, forecast -0.5%.
The report on durable goods orders in the US for July kept the downward trend and indicated a decrease in demand for this group of goods in May.
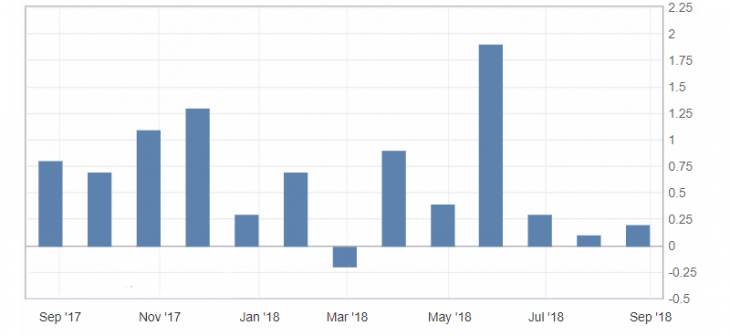
Graph of durable goods orders in the US
The dynamics of the US dollar remains restrainedly negative, which is largely due to the continued optimism in the market and the strengthening of risky assets. This eventually caused the resumption of the decline in the US dollar index and its consolidation below the level of 95.50. As a result, a support level test is possible: 95.20 and 95.00.
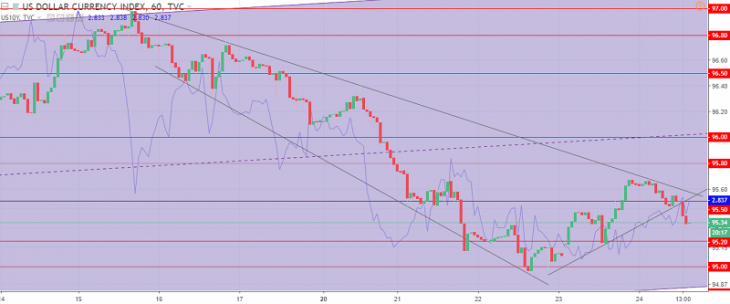
The US dollar index chart. The current price is 95.30 (10-year government bonds yield is a blue line)
Read also: “Government Bonds – Mechanism of Trade and Correlation with the Currency Market”
Hanzenko Anton
Earn with the help of the trade service on the news Erste News!
Topical articles of the trader’s blog:
- Trade balance influence on the country’s economy
- Stock indices : Asia-Pacific region
- Collapse of the Turkish lira. A threat to the market!
Current Investment ideas: