
Data on U.S. existing home sales
- Existing home sales in the US, fact 5.38M, forecast 5.46M.
- Existing home sales in the US (m / m), fact -0.6%, forecast 0.5%.
Data on existing home sales in the US show a slowdown for the third month in a row, thus indicating a general slowdown in this indicator.
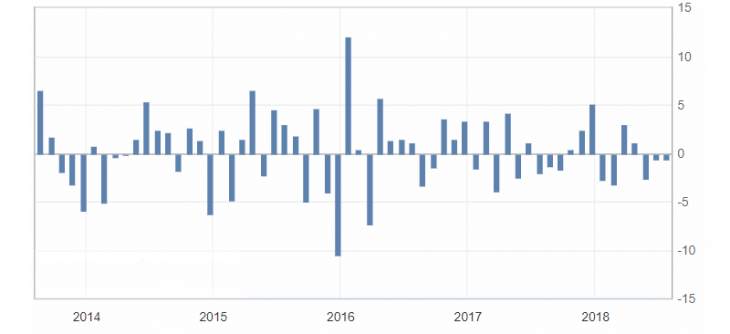
Fig. 1. Graph of the dynamics of the secondary housing market in the US
The US dollar index, in turn, remains limited by risks and the trading range from 94.60 to 94.20, thus indicating a limited correction and the preservation of negative sentiment.
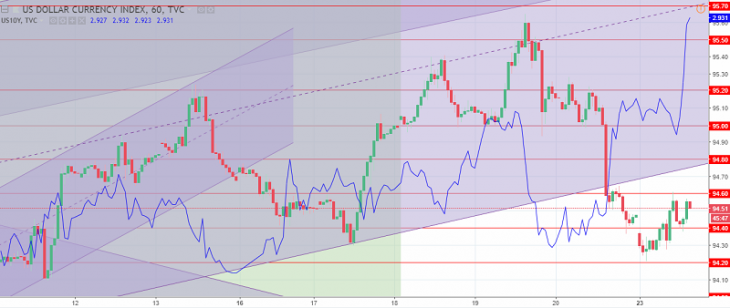
Fig. 2.The US dollar index chart. The current price is 95.50 (10-year government bonds yield is a blue line)
Read also: “Forex Averaging Strategy”
Hanzenko Anton
Earn with the help of the trade service on the news Erste News!
Topical articles of the trader’s blog: