Technical analysis of cross-rates. (Anton Hanzenko)
Forex indicators used in Technical analysis: MACD, RSI, Ichimoku Kinko Hyo, Equal-channel, Fibonacci lines, Price Levels.
Earn with the help of the trade service on the news Erste News!
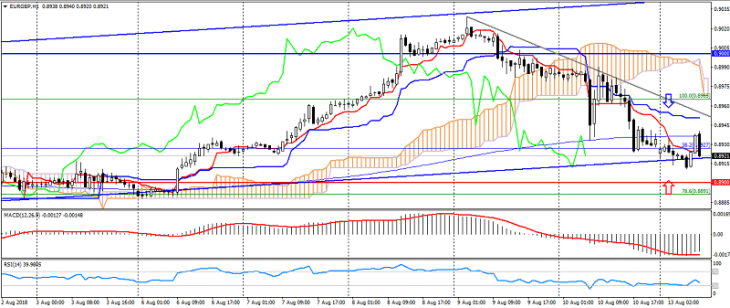
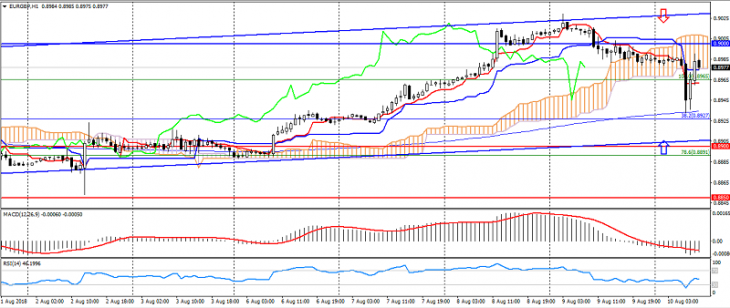
EUR GBP (current price: 0.8920)
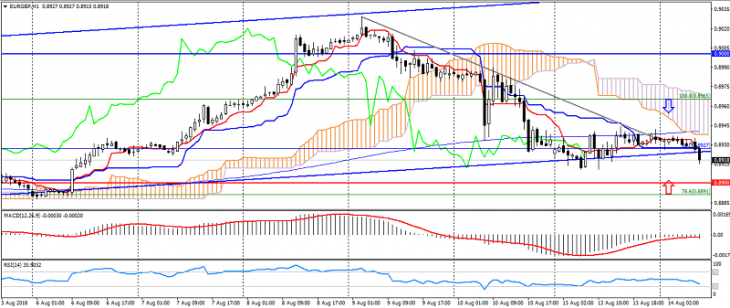
- Support levels: 0.8900, 0.8850, 0.8800.
- Resistance levels: 0.9000 (strong psychology), 0.9070, 0.9150.
- Computer analysis: MACD (12, 26, 9) (signal – downward movement): the indicator is below 0, the signal line in the body of the histogram. RSI (14) in the neutral zone. Ichimoku Kinko Hyo (9, 26, 52) (signal – downward movement): the Tenkan-sen line is below the Kijun-sen line, the price is below the cloud.