
Data on new home sales in the US
- New home sales (m / m) (July), fact -1.7%, forecast 2.2%.
- New home sales (July), fact 627K, forecast 643K.
The primary housing market in the US demonstrates a slowdown for the fourth month in a row limited to the highs of 2017. Against the backdrop of disappointing data, in the secondary real estate market and uncertainty in the market, a slowdown in real estate sales could negatively affect the dynamics of the US dollar.
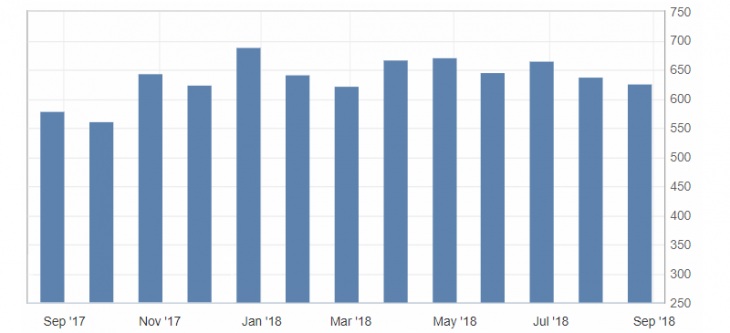
Graph of the new home sales in the USA
The US dollar index, in turn, remains caught in the channel from 95.20 to 95.50, indicating the continued uncertainty in the market and the possibility of forcing correction after a prolonged decline.
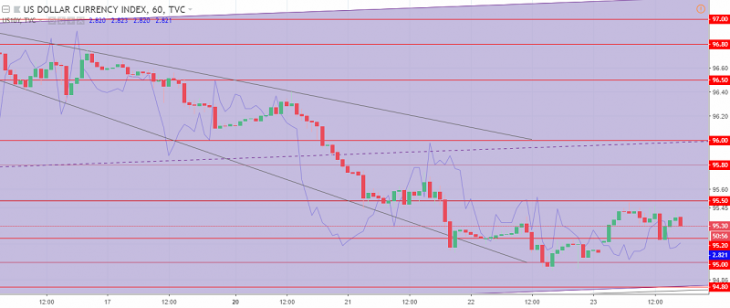
The US dollar index chart. The current price is 95.30 (10-year government bonds yield is a blue line)
Read also: Elliott Wave Theories: Correction Prediction and Channel Formation
Hanzenko Anton
Earn with the help of the trade service on the news Erste News!
Topical articles of the trader’s blog:
- Trade balance influence on the country’s economy
- Stock indices : Asia-Pacific region
- Collapse of the Turkish lira. A threat to the market!
Current Investment ideas: