Technical analysis

Technical analysis of gold and silver (Andre Green)

Forex indicators used in Technical analysis: MACD, RSI, Ichimoku Kinko Hyo, Equal-channel, Fibonacci lines, Price Levels.

Earn with the help of the trade service on the news Erste News!


Gold chart (current price: $ 1188.00)


Gold accelerated growth on maintaining optimistic sentiment and overall correction after the decline.
Technical analysis of oil (Dani Leviant)

Forex indicators used in Technical analysis: MACD, RSI, Ichimoku Kinko Hyo, Equal-channel, Fibonacci lines, Price Levels.

Earn with the help of the trade service on the news Erste News!


Oil is strengthening at the beginning of the week on the growth of optimism and the preservation of the number of oil rigs in the United States.

Brent brand chart (current price: $ 72.20)


Brent brand resumed growth at the start of the week, remaining in the correction phase, but also maintaining a general downward trend.

Technical analysis of cross-rates. (Anton Hanzenko)

Forex indicators used in Technical analysis: MACD, RSI, Ichimoku Kinko Hyo, Equal-channel, Fibonacci lines, Price Levels.

Earn with the help of the trade service on the news Erste News!


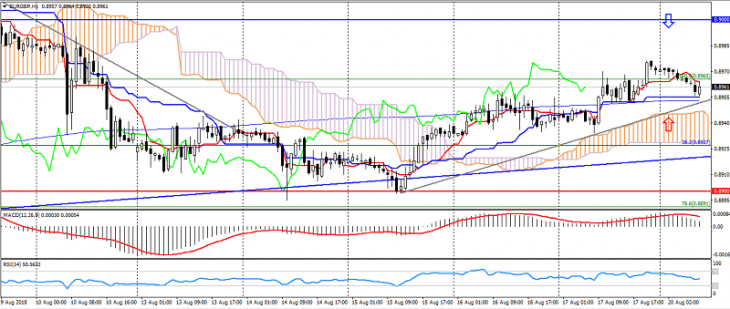
EUR GBP (current price: 0.8960)

  • Support levels: 0.8900, 0.8850, 0.8800.
  • Resistance levels: 0.9000 (strong psychology), 0.9070, 0.9150.
  • Computer analysis: MACD (12, 26, 9) (signal – downward movement): the indicator is higher than 0, the signal line has left the body of the histogram. RSI (14) in the neutral zone. Ichimoku Kinko Hyo (9, 26, 52) (signal – upward movement): the Tenkan-sen line above the Kijun-sen line, the price is higher than the cloud.

Тechnical analysis of currency pairs (Anton Hanzenko)

Forex indicators used in Technical analysis: MACD, RSI, Ichimoku Kinko Hyo, Equal-channel, Fibonacci lines, Price Levels.

Earn with the help of the trade service on the news Erste News!


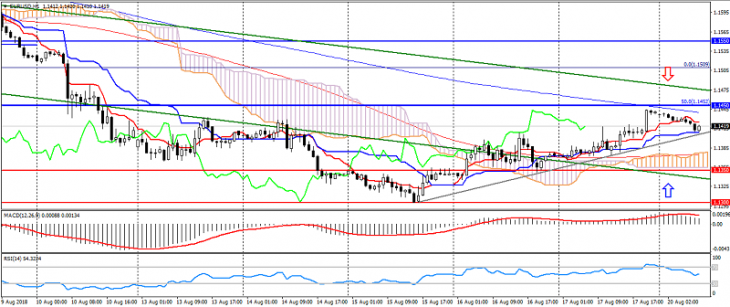
EUR USD (current price: 1.1420)

  • Support levels: 1.1350, 1.1300, 1.1200.
  • Resistance levels: 1.1450, 1.1550, 1.1650.
  • Computer analysis: MACD (12, 26, 9) (signal – downward movement): the indicator is higher than 0, the signal line has left the body of the histogram. RSI (14) in the neutral zone. Ichimoku Kinko Hyo (9, 26, 52) (signal – upward movement): the Tenkan-sen line above the Kijun-sen line, the price is higher than the cloud.

Technical analysis of gold and silver (Andre Green)

Forex indicators used in Technical analysis: MACD, RSI, Ichimoku Kinko Hyo, Equal-channel, Fibonacci lines, Price Levels.

Earn with the help of the trade service on the news Erste News!


Gold chart (current price: $ 1177.00)


Gold is traded with a slight strengthening on the correction after the decline, while limiting itself to a downward trend, which in the end may limit further decline in the value of gold.

Technical analysis of oil (Dani Leviant)

Forex indicators used in Technical analysis: MACD, RSI, Ichimoku Kinko Hyo, Equal-channel, Fibonacci lines, Price Levels.

Earn with the help of the trade service on the news Erste News!


Oil strengthens its position on the growth of optimism and further decline in the US dollar.

Brent brand chart (current price: $ 71.80)


Brand Brent accelerated growth after a restrained correction, which was caused by the general growth of optimism in the markets and the decline in the US currency.

Technical analysis of cross-rates. (Anton Hanzenko)

Forex indicators used in Technical analysis: MACD, RSI, Ichimoku Kinko Hyo, Equal-channel, Fibonacci lines, Price Levels.

Earn with the help of the trade service on the news Erste News!


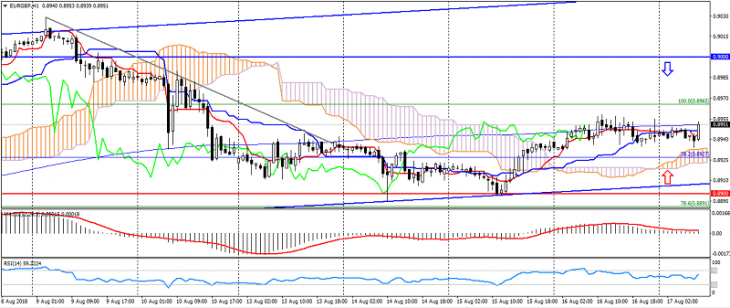
EUR GBP (current price: 0.8950)

  • Support levels: 0.8900, 0.8850, 0.8800.
  • Resistance levels: 0.9000 (strong psychology), 0.9070, 0.9150.
  • Computer analysis: MACD (12, 26, 9) (signal – upward movement): indicator above 0, signal line in the body of the histogram. RSI (14) in the neutral zone. Ichimoku Kinko Hyo (9, 26, 52) (signal – upward movement): the Tenkan-sen line above the Kijun-sen line, the price is higher than the cloud.

Тechnical analysis of currency pairs (Anton Hanzenko)

Forex indicators used in Technical analysis: MACD, RSI, Ichimoku Kinko Hyo, Equal-channel, Fibonacci lines, Price Levels.

Earn with the help of the trade service on the news Erste News!


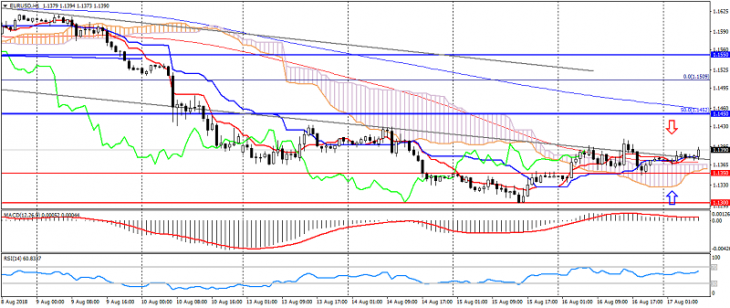
EUR USD (current price: 1.1390)

  • Support levels: 1.1350, 1.1300, 1.1200.
  • Resistance levels: 1.1450, 1.1550, 1.1650.
  • Computer analysis: MACD (12, 26, 9) (signal – upward movement): indicator above 0, signal line in the body of the histogram. RSI (14) in the neutral zone. Ichimoku Kinko Hyo (9, 26, 52) (signal – upward movement): the Tenkan-sen line above the Kijun-sen line, the price is higher than the cloud.

Technical analysis of gold and silver (Andre Green)

Forex indicators used in Technical analysis: MACD, RSI, Ichimoku Kinko Hyo, Equal-channel, Fibonacci lines, Price Levels.

Earn with the help of the trade service on the news Erste News!


Gold chart (current price: $ 1180.00)


Gold is traded with a strengthening on the correction after the minimum is updated, thereby indicating the formation of the correction phase in a downtrend.