Тechnical analysis of currency pairs (Anton Hanzenko)
Forex indicators used in Technical analysis: MACD, RSI, Ichimoku Kinko Hyo, Equal-channel, Fibonacci lines, Price Levels.
Earn with the help of the trade service on the news Erste News!
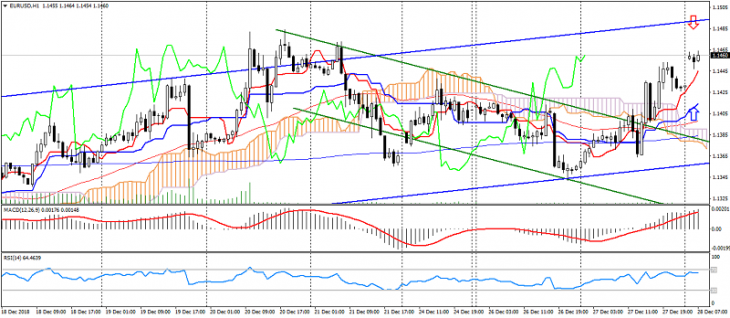
EUR USD (current price: 1.1460)
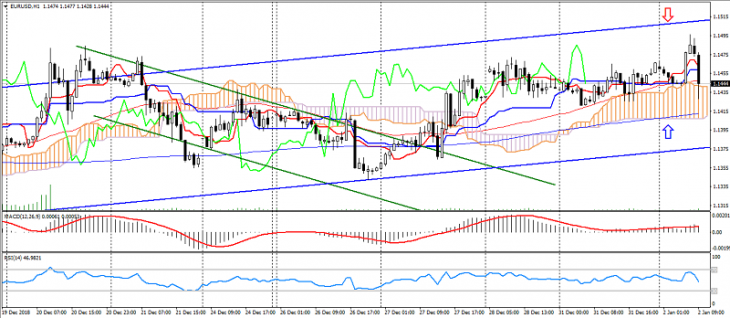
- Support levels: 1.1350, 1.1200, 1.1100.
- Resistance levels: 1.1450, 1.1550, 1.1650.
- Computer analysis: MACD (12, 26, 9) (signal – upward movement): the indicator is above 0, the signal line in the body of the histogram. RSI (14) in the overbought zone. Ichimoku Kinko Hyo (9, 26, 52) (signal – upward movement): Tenkan-sen line is above the Kijun-sen line, the price is above the cloud.