
Technical analysis of gold and silver (Alexander Sivtsov)
Gold chart (current price: $ 1289.60)
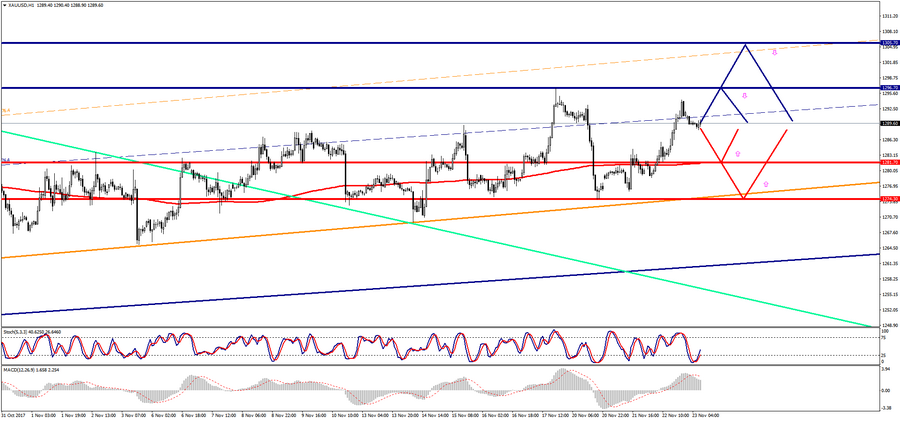
Gold is trading below the zero mark during the Asian session.
- Resistance 1: From $ 1296.70 (November 17 maximum)
- Resistance 2: From $ 1305.70 (October 16 maximum)
- Support 1: From $ 1281.70 (MA 200 to H1)
- Support 2: From $ 1274.30 (November 20 minimum)
Computer analysis: The Stochastic Oscillator movings on the D1 chart are in the neutral zone, the consolidation of the gold price is possible.
Silver chart (current price: $ 17.04)
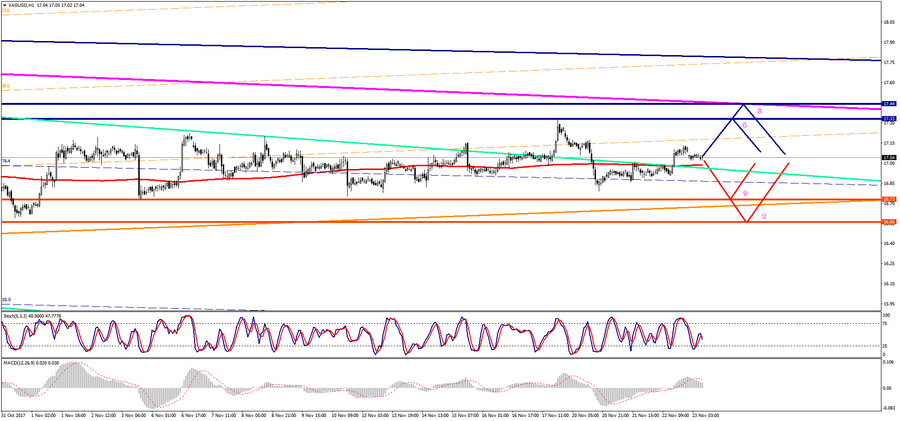
Silver is trading with a minus during the Asian session.
- Resistance 1: From $ 17.33 (November 15 maximum)
- Resistance 2: From $ 17.44 (Low resistance line of the channel on W1)
- Support 1: From $ 16.73 (November 3 minimum)
- Support 2: From $ 16.56 (October 27 minimum)
Computer analysis: The Stochastic Oscillator movings on the D1 chart are in the neutral zone, so the situation can be similar to gold.