
Тechnical analysis of currency pairs (Anton Hanzenko)
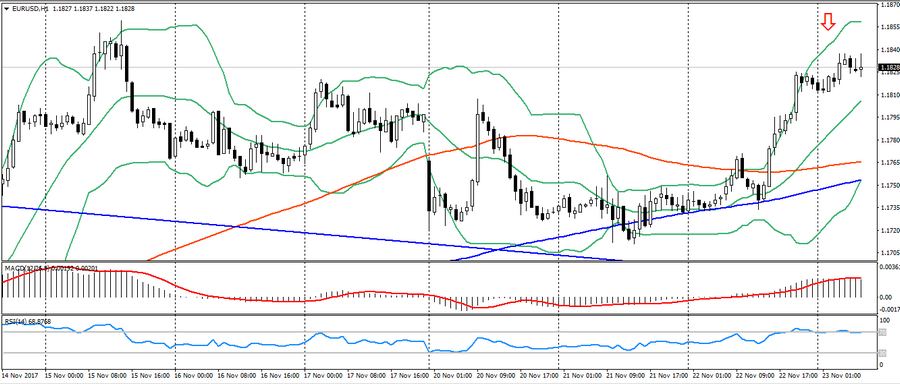
EUR USD (current price: 1.1830)
- Support levels: 1.1700 (August 2015 maximum), 1.1600 (2016 maximum), 1.1470.
- Resistance levels: 1.2000, 1.2100, 1.2270 (November 2014 minimum).
- Computer analysis: MACD (signal – upward motion): the indicator is above 0, the signal line is in the body of the histogram. RSI is in the overbought zone. Bollinger Bands (period 20): neutral, declining volatility.
- The main recommendation: sale entry is started from 1.1840 (MA 100), 1.1860, 1.1900.
- Alternative recommendation: buy entry is started from 1.1800, 1.1770 (MA 100), 1.1750 (MA 200).
The euro strengthens the position early in the day on the weakness of the American, but due to a significant overbought further growth of this pair will be limited.
GBP USD (current price: 1.3310)
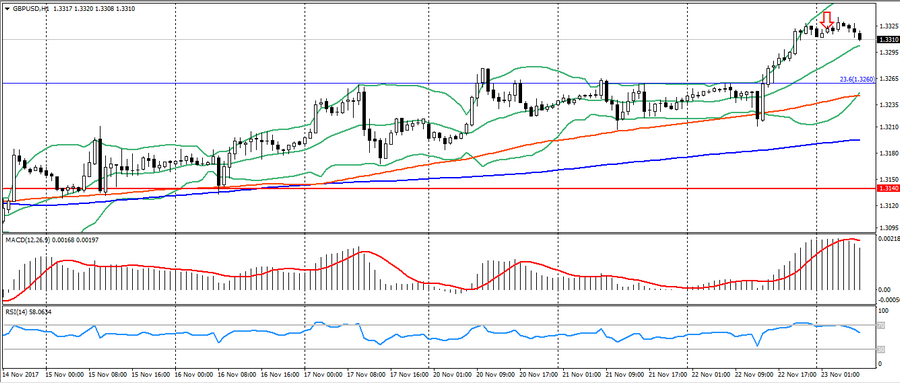
- Support levels: 1.3140, 1.2900, 1.2740 (August 2017 minimum).
- Resistance levels: 1.3500, 1.3660, 1.3830 (February 2016 minimum).
- Computer analysis: MACD (signal – downward motion): the indicator is higher than 0, the signal line has left the body of the histogram. RSI is in the neutral zone. Bollinger Bands (period 20): neutral, declining volatility.
- The main recommendation: sale entry is started from 1.3340, 1.3370, 1.3400.
- Alternative recommendation: buy entry is started from 1.3260 (Fibo, 23.6 from the January low), 1.3200 (MA 200), 1.3140.
The British pound is under pressure of correction and the resumption of the general trend.
USD CHF (current price: 0.9810)
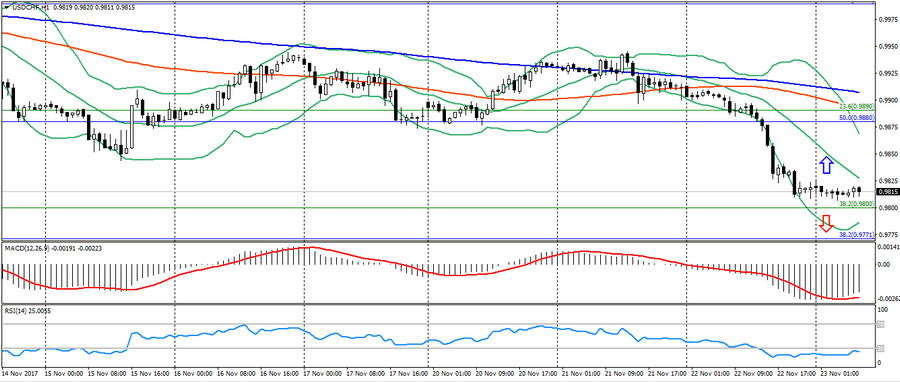
- Support levels: 0.9700, 0.9600, 0.9530.
- Resistance levels: 1.0000, 1.0050, 1.0100 (May maximum).
- Computer analysis: MACD (signal – upward motion): the indicator is below 0, the signal line has left the body of the histogram. RSI is in the oversold zone. Bollinger Bands (period 20): neutral, declining volatility.
- The main recommendation: sale entry is started from 0.9840 (MA 200), 0.9860, 0.9880 (Fibo.50.0 from the high of November 2016).
- Alternative recommendation: buy entry is started from 0.9800, 0.9770 (Fibo, 38.2 from November 2016 high), 0.9740.
The Swiss franc remains trading near the highs of the month due to the uncertainty of the market.
USD JPY (current price: 111.20)
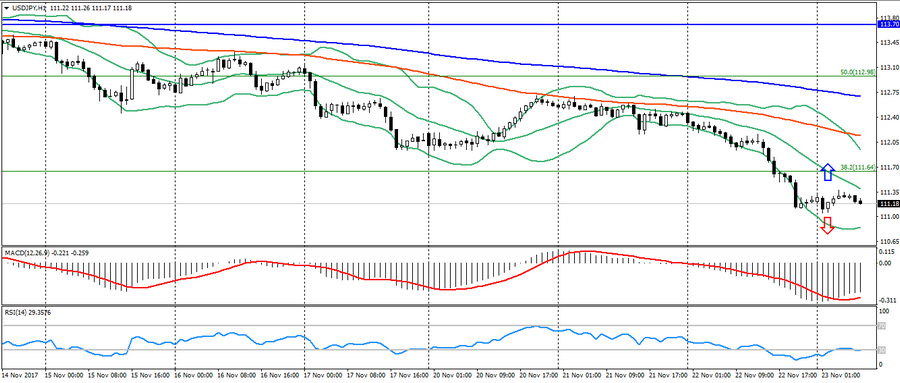
- Support levels: 108.90, 108.10 (April 2017 minimum), 107.30 (2017 minimum).
- Resistance levels: 113.70, 114.50 (July 2017 msximum), 115.00.
- Computer analysis: MACD (signal – upward motion): the indicator is below 0, the signal line has left the body of the histogram. RSI is in the oversold zone. Bollinger Bands (period 20): neutral, declining volatility.
- The main recommendation: sale entry is started from 111.60 (Fibo. 38.2 from the maximum of December), 112.20 (MA 100), 112.50.
- Alternative recommendation: buy entry is started from 111.00, 110.80, 110.50.
The Japanese yen also remains in uncertainty due to the overbought and risk growth opportunities.
USD CAD (current price: 1.2690)
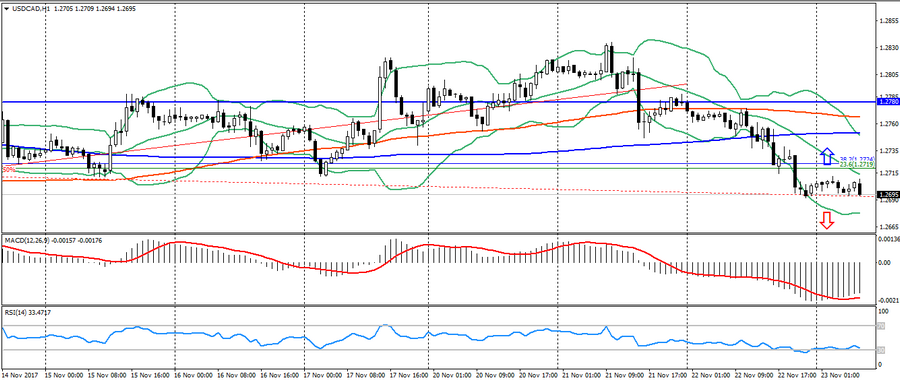
- Support levels: 1.2200, 1.2060 (2017 minimum), 1.1950 (2015 minimum).
- Resistance levels: 1.2780 (August 2017 hmaximum), 1.3000, 1.3160.
- Computer analysis: MACD (signal – upward motion): the indicator is below 0, the signal line has left the body of the histogram. RSI is in the oversold zone. Bollinger Bands (period 20): neutral, declining volatility.
- The main recommendation: sale entry is started from 1.2720 (Fibo, 23.6 September low), 1.2750 (MA 200), 1.2780.
- Alternative recommendation: buy entry is started from 1.2680 (MA 200 per H4), 1.2660, 1.2630.
The Canadian dollar keeps growing on the resumption of the downward dynamics of the pair and rising prices on raw materials.
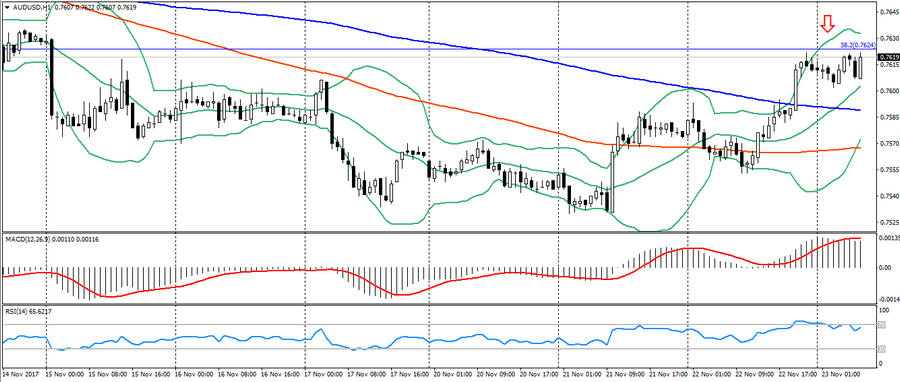
AUD USD (current price: 0.7620)
- Support levels: 0.7740, 0.7320 (2017 minimum), 0.7120.
- Resistance levels: 0.8120 (2017 maximum), 0.8200, 0.8290 (2014 maximum).
- Computer analysis: MACD (signal – upward motion): the indicator is above 0, the signal line is in the body of the histogram. RSI is in the overbought zone. Bollinger Bands (period 20): neutral, declining volatility.
- The main recommendation: sale entry is started from 0.7630 (Fibo, 38.2 from the low of January 2016), 0.7650, 0.7670.
- Alternative recommendation: buy entry is started from 0.7590 (MA 200), 0.7570 (MA 100), 0.7550.
The Australian also has strengthened on growth of the prices on raw materials, but it is limited to the overbought zone.
NZD USD (current price: 0.6880)
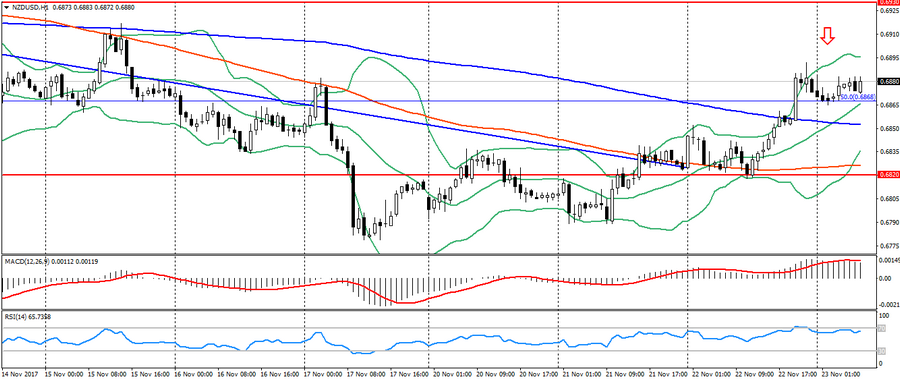
- Support levels: 0.7000, 0.6930, 0.6820 (the minimum of the current year).
- Resistance levels: 0.7380, 0.7450, 0.7550 (2017 maximum).
- Computer analysis: MACD (signal – upward motion): the indicator is above 0, the signal line is in the body of the histogram. RSI is in the overbought zone. Bollinger Bands (period 20): neutral, declining volatility.
- The main recommendation: sale entry is started from 0.6890, 0.6910, 0.6930.
- Alternative recommendation: buy entry is started from 0.6850 (MA 200), 0.6820, 0.6790.
The New Zealand dollar also remains in the overbought zone, which may cause a correction.
XAU USD (current price: 1289.00)
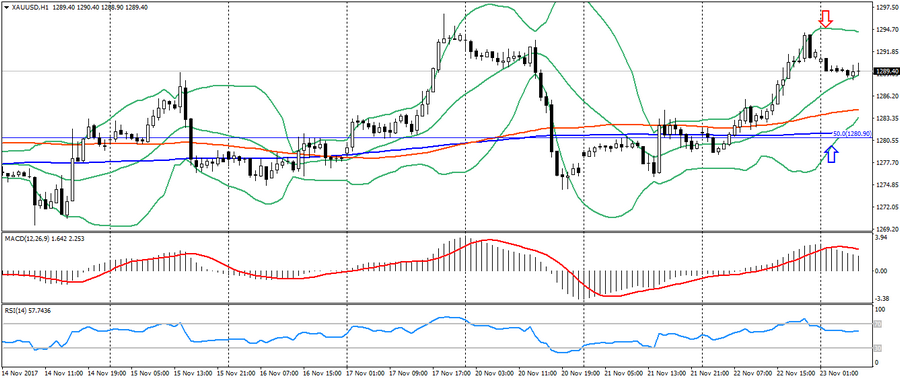
- Support levels: 1250.00, 1226.00, 1200.00.
- Resistance levels: 1340.00, 1355.00, 1374.00 (2016 maximum).
- Computer analysis: MACD (signal – downward motion): the indicator is higher than 0, the signal line has left the body of the histogram. RSI is in the neutral zone. Bollinger Bands (period 20): neutral, declining volatility.
- The main recommendation: sale entry is started from 1292.00, 1295.00, 1297.00.
- Alternative recommendation: buy entry is started from 1284.00, 1281.00 (Fibo., 50.0 from the July low), 1277.00.
Gold weakened slightly at the beginning of the day, but still maintains a restrained-ascending trend.