Technical analysis of gold and silver (Alexander Sivtsov)
Gold chart (current price: $ 1354.20)
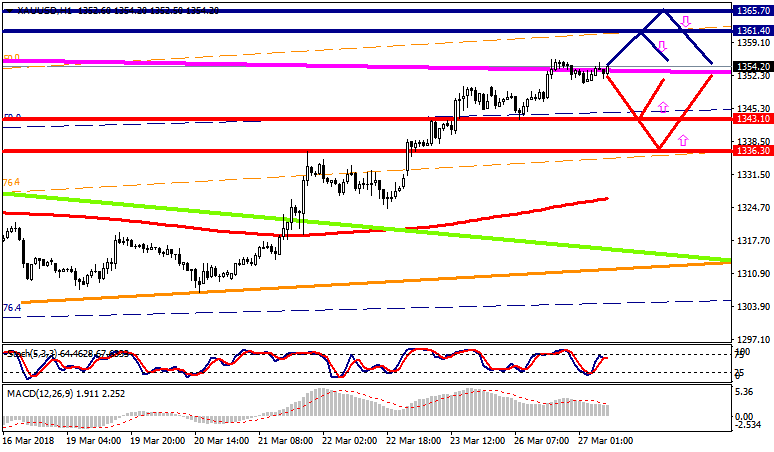
Gold is traded near the zero mark during the Asian session.
Resistance 1: From $ 1361.40 (February 16 maximum)
Resistance 2: From $ 1365.70 (January 25 maximum)
Support 1: From $ 1343.10 (March 21 minimum)
Support 2: From $ 1336.30 (March 26 maximum)
Computer analysis: The Stochastic Oscillator movings on the H4 chart indicate overbought of the instrument, against which one should expect a decline in the price of gold.
Silver chart (current price: $ 16.71)
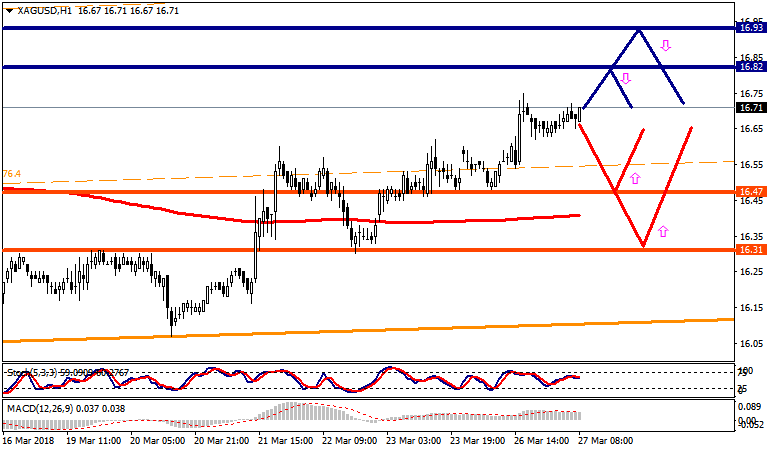
Silver is traded with a plus during the Asian session.
Resistance 1: From $ 16.82 (March 6 maximum)
Resistance 2: From $ 16.93 (February 15 maximum)
Support 1: From $ 16.47 (March 26 maximum)
Support 2: From $ 16.31 (technical level)
Computer analysis: The Stochastic Oscillator movings on the chart of H1 are in the neutral zone, against which the formation of the consolidation of the price of silver is possible.