
Technical analysis of gold and silver (Alexander Sivtsov)
Gold chart (current price: $ 1313.50)
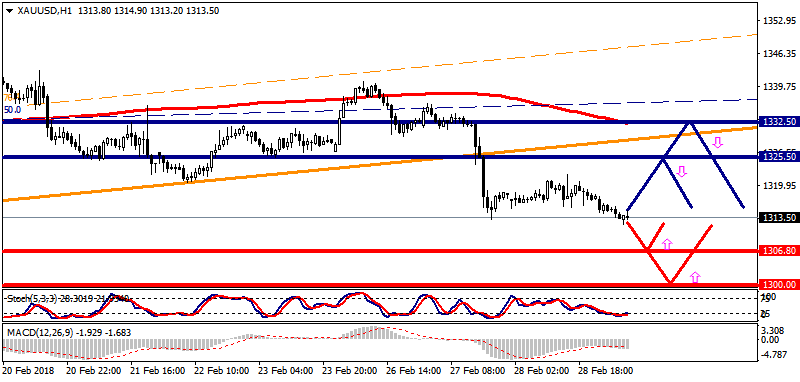
Gold is traded near the zero mark during the Asian session.
- Resistance 1: From $ 1325.50 (technical level)
- Resistance 2: From $ 1332.50 (MA 200 on H1)
- Support 1: From $ 1306.80 (February 8 minimum)
- Support 2: From $ 1300.00 (psychological level)
Computer analysis: The Stochastic Oscillator movings on the chart of H1 indicate the oversold of the instrument, the price of gold is possible.
Silver chart (current price: $ 16.30)
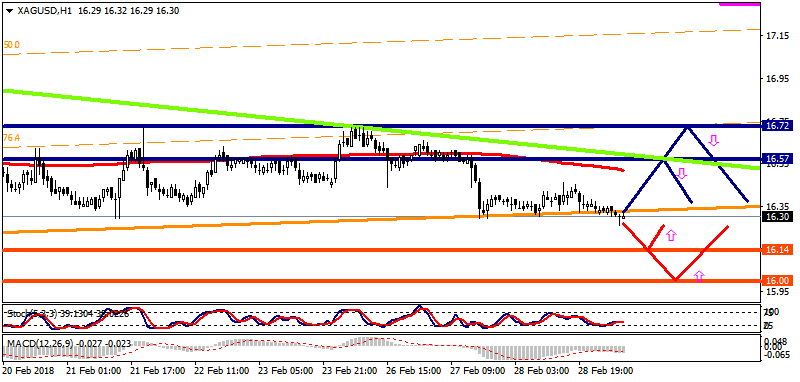
Silver is traded with a minus during the Asian session.
- Resistance 1: From $ 16.57 (Low resistance line of the channel on H1)
- Resistance 2: From $ 16.72 (February 26 maximum)
- Support 1: From $ 16.14 (February 9 minimum)
- Support 2: From $ 16.00 (psychological level)
Computer analysis: The Stochastic Oscillator movings on the charts of H1 and H4 are in the neutral zone, the consolidatation of the price of silver is possible.