
Technical analysis of gold and silver (Alexander Sivtsov)
Gold chart (current price: $ 1339.40)
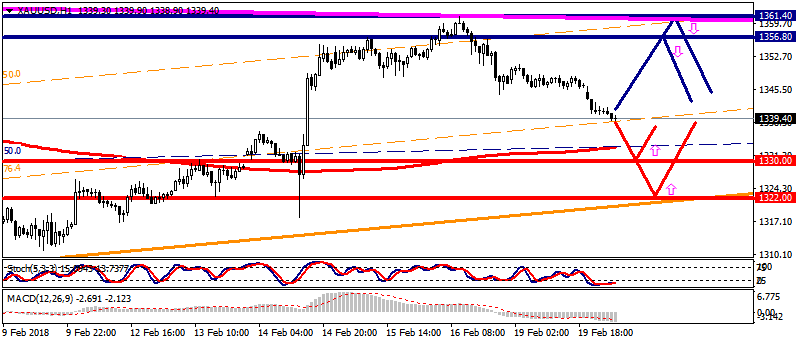
Gold is traded below the zero mark during the Asian session.
- Resistance 1: From $ 1356.80 (February 15 maximum)
- Resistance 2: From $ 1361.40 (February 16 high)
- Support 1: From $ 1330.00 (technical level)
- Support 2: With $ 1322.00 (Support line of the Up Channel on H4)
Computer analysis: The Stochastic Oscillator movings on the charts of H1 and H4 indicate the oversold of the instrument, the recovery of the price of gold is possible.
Silver chart (current price: $ 16.49)
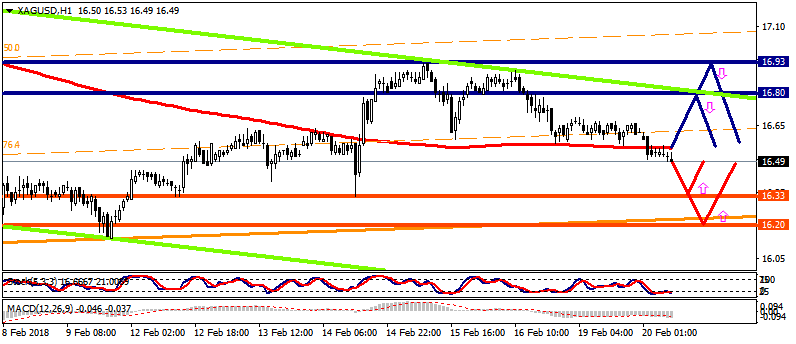
Silver is traded with a minus during the Asian session.
- Resistance 1: From $ 16.80 (resistance line of the Low channel on H1)
- Resistance 2: From $ 16.93 (February 15 maximum)
- Support 1: From $ 16.33 (February 14 minimum)
- Support 2: From $ 16.20 (February 8 minimum)
Computer analysis: The Stochastic Oscillator movings on the chart H1 indicate the oversold of the instrument, so one should expect a slight increase in the price of silver.