
Technical analysis of gold and silver (Alexander Sivtsov)
Gold chart (current price: $ 1354.30)
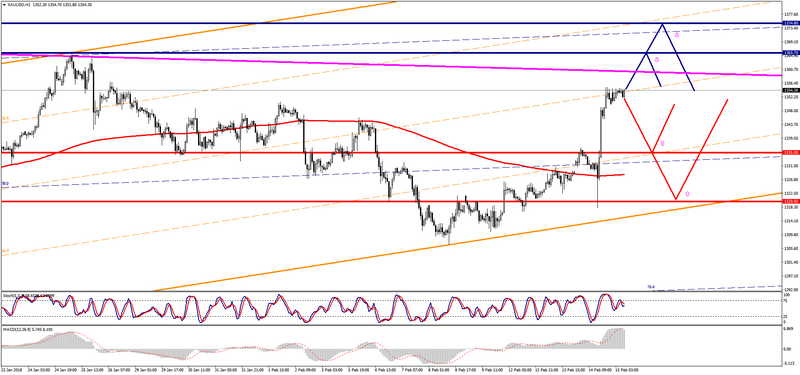
Gold is trading near the zero mark during the Asian session.
- Resistance 1: From $ 1365.70 (January 25 maximum)
- Resistance 2: From $ 1374.80 (2016 maximum)
- Support 1: From $ 1335.00 (technical level)
- Support 2: From $ 1320.00 (technical level)
Computer analysis: The Stochastic Oscillator movings on the H4 chart indicate overbought of the instrument, against which there may be some decrease in the price of gold.
Silver chart (current price: $ 16.88)
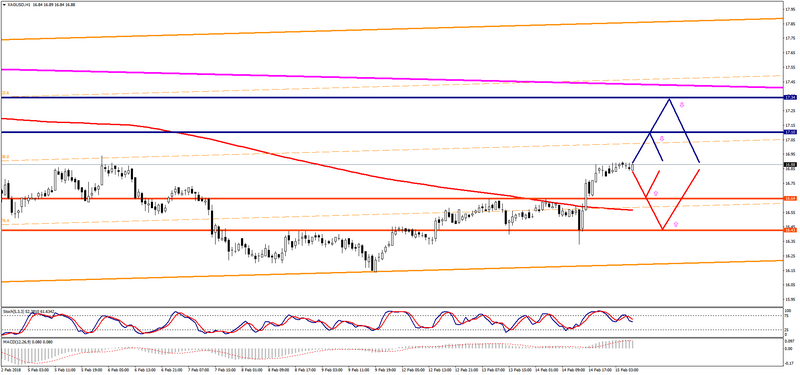
Silver is traded near the zero mark during the Asian session.
- Resistance 1: From $ 17.10 (technical level)
- Resistance 2: From $ 17.34 (January 31 maximum)
- Support 1: From $ 16.64 (February 13 maximum)
- Support 2: From $ 16.43 (technical level)
Computer analysis: The Stochastic Oscillator movings on the H4 chart indicate overbought of the instrument, against which a downward correction in the price of silver is possible.