
Technical analysis of gold and silver (Alexander Sivtsov)
Gold chart (current price: $ 1342.70)
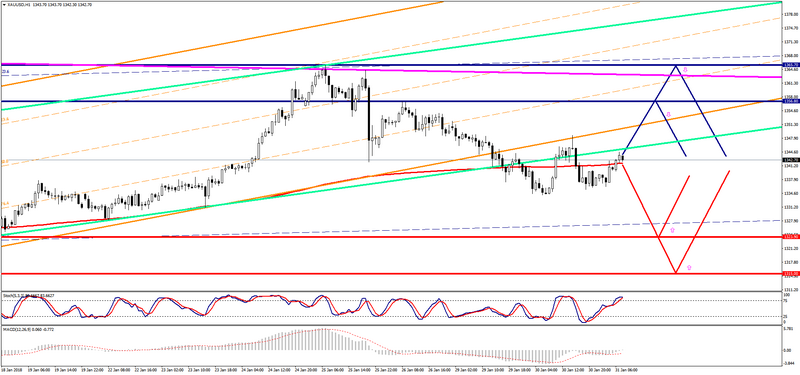
Gold is traded above the zero mark during the Asian session.
- Resistance 1: From $ 1356.80 (January 26 maximum)
- Resistance 2: From $ 1365.70 (January 25 maximum))
- Support 1: From $ 1323.90 (January 18 minimum)
- Support 2: From $ 1315.00 (technical level)
Computer analysis: The Stochastic Oscillator movings on the H1 chart indicate overbought of the instrument, one should expect a certain decrease in the price of gold during the European session.
Silver chart (current price: $ 17.16)
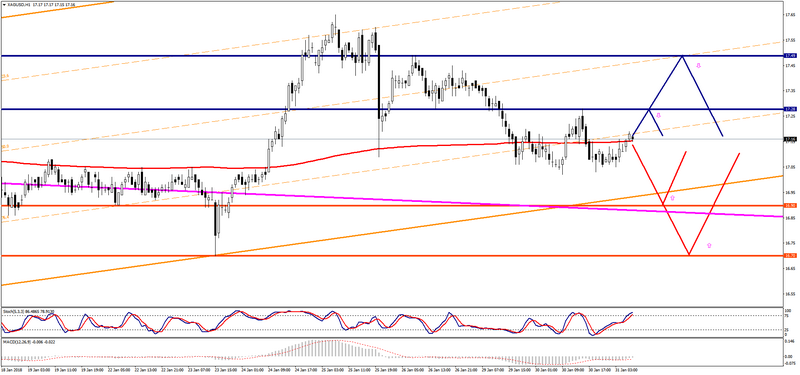
Silver is traded with a plus during the Asian session.
- Resistance 1: From $ 17.28 (January 26 minimum)
- Resistance 2: From $ 17.49 (January 26 maximum)
- Support 1: From $ 16.90 (technical level)
- Support 2: From $ 16.70 (January 23 minimum)
Computer analysis: The Stochastic Oscillator movings on the H1 chart indicate overbought of the instrument, so there may be some reduction in the price of silver.