
Technical analysis of gold and silver (Alexander Sivtsov)
Gold chart (current price: $ 1341.70)
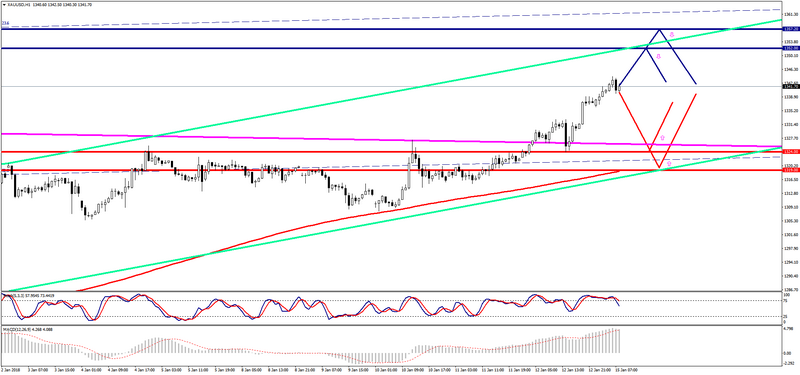
Gold is traded above the zero mark during the Asian session.
- Resistance 1: With $ 1352.00 (resistance line of Up channel on H1)
- Resistance 2: From $ 1357.20 (September 8 maximum)
- Support 1: From $ 1324.00 (technical level)
- Support 2: From $ 1319.00 (support line of Up Channel on H1)
Computer analysis: The Stochastic Oscillator movings on the charts of H1 and H4 indicate overbought of the instrument, there may be some reduction in the price of gold.
Silver chart (current price: $ 17.31)
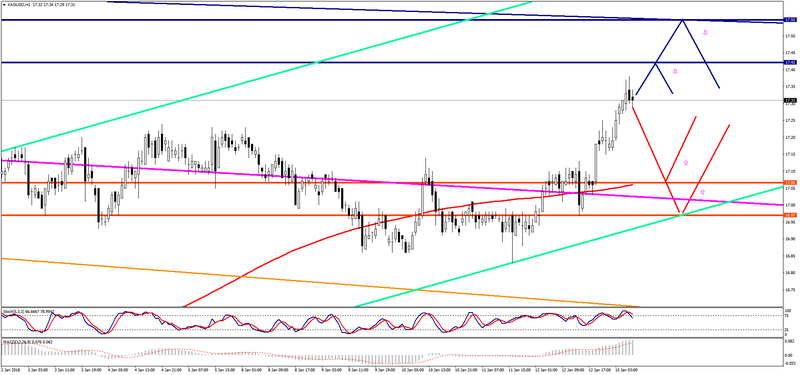
Silver is traded with a plus during the Asian session.
- Resistance 1: From $ 17.42 (October 16 maximum)
- Resistance 2: From $ 17.55 (resistance line of the Low channel on D1)
- Support 1: From $ 17.06 (MA 200 on H1)
- Support 2: From $ 16.97 (support line of Up Channel on H1)
Computer analysis: The Stochastic Oscillator movings on the charts of H1 and H4 indicate overbought of the instrument, in connection with which one should expect some reduction in the price of silver.