
Technical analysis of gold and silver (Alexander Sivtsov)
Gold chart (current price: $ 1295.20)
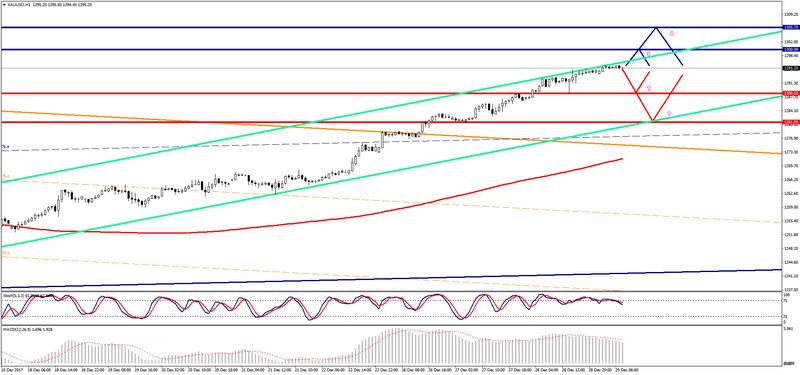
Gold is trading near the zero mark during the Asian session.
- Resistance 1: From $ 1300.00 (psychological level)
- Resistance 2: From $ 1305.70 (October 16 maximum)
- Support 1: From $ 1288.60 (December 27 maximum)
- Support 2: From $ 1281.00 (December 27 minimum)
Computer analysis: The Stochastic Oscillator movings on the charts of H4 and D1 indicate overbought of the instrument, one should expect a downward correction in the price of gold.
Silver chart (current price: $ 16.79)
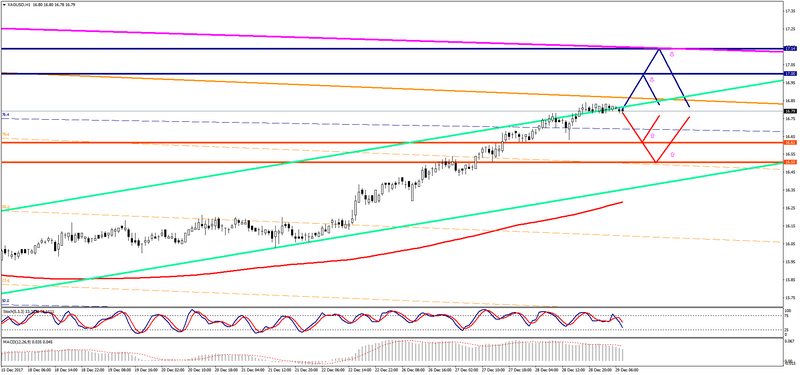
Silver is trading slightly below the zero mark during the Asian session.
- Resistance 1: From $ 17.00 (psychological level)
- Resistance 2: From $ 17.14 (Low resistance line of the channel on W1)
- Support 1: From $ 16.61 (December 28 minimum)
- Support 2: From $ 16.50 (technical level)
Computer analysis: The Stochastic Oscillator movings on the charts of H4 and D1 indicate overbought of the instrument, in connection with which there may be some reduction in the price of silver.