Technical analysis of gold and silver (Alexander Sivtsov)
Gold chart (current price: $ 1284.20)
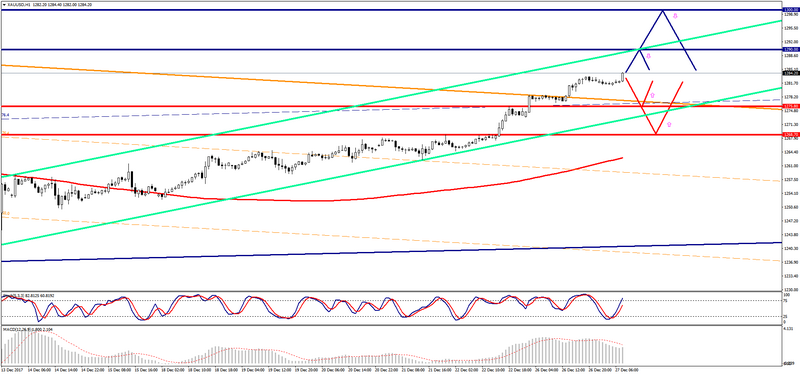
Gold is trading with a small plus during the Asian session.
- Resistance 1: With $ 1290.00 (line of resistance of the Up channel on H1)
- Resistance 2: From $ 1300.00 (psychological level)
- Support 1: From $ 1275.80 (December 22 maximum)
- Support 2: From $ 1268.70 (December 21 maximum)
Computer analysis: The Stochastic Oscillator movings on the charts of H4 and D1 indicate overbought of the instrument, one should expect a downward correction in the price of gold.
Silver chart (current price: $ 16.54)
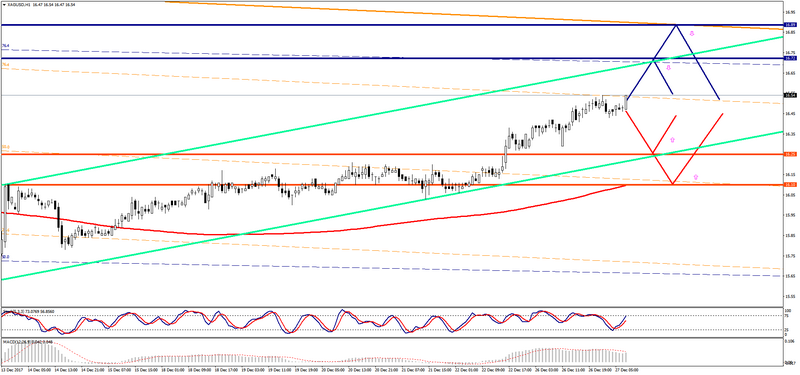
Silver is trading slightly above the zero mark during the Asian session.
- Resistance 1: From $ 16.72 (November 28 minimum)
- Resistance 2: From $ 16.89 (Low resistance line on H4)
- Support 1: From $ 16.25 (Support Up Channel on H1)
- Support 2: From $ 16.10 (MA 200 on H1)
Computer analysis: The Stochastic Oscillator movings on the charts of H4 and D1 indicate overbought of the instrument, the reduction in the price of silver is possible.