
Технічний аналіз валютных пар (Антон Ганзенко)
EUR USD (поточна ціна: 1.2330)
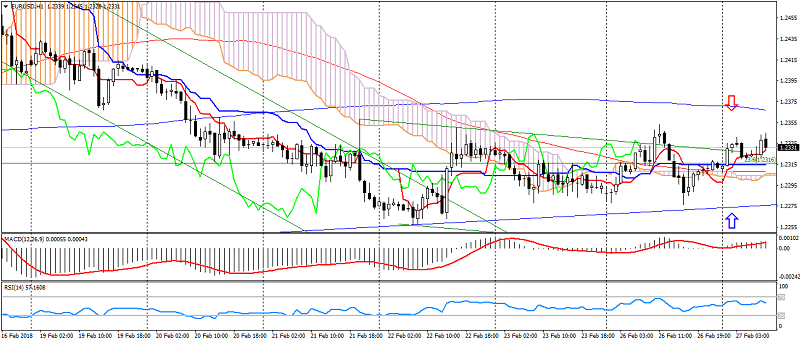
- Рівні підтримки: 1.2100 (максимум вересня 2017 року), 1.1900, 1.1700.
- Рівні опору: 1.2600, 1.2750 (мінімум березня 2013 року), 1.2270 (мінімум листопада 2014 року).
- Комп’ютерний аналіз: MACD (12,26,9) (сигнал – висхідний рух): індикатор вище 0, сигнальна лінія в тілі гістограми. RSI (14) в нейтральній зоні. IchimokuKinkoHyo (9,26,52) (сигнал – висхідний рух): лінія Tenkan-sen вище лінії Kijun-sen, ціна вище хмари.
- Основна рекомендація: вхід на продаж від 1.2350, 1.2370, 1.2390.
- Альтернативна рекомендація: вхід на покупку від 1.2300, 1.2280, 1.2250.
Пара євро долар торгується в усталеному торговому діапазоні, чекаючи даних по США, що вказує на невизначеність ринку.
GBP USD (поточна ціна: 1.3970)
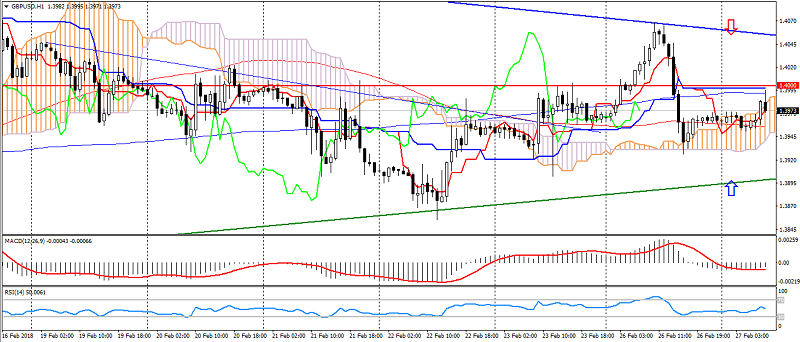
- Рівні підтримки: 1.4000 (мінімум квітня 2016 року), 1.3820, 1.3650 (максимум вересня 2017 року).
- Рівні опору: 1.4350, 1.4500, 1.4750 (максимум травня 2016 року).
- Комп’ютерний аналіз: MACD (12,26,9) (сигнал – висхідний рух): індикатор нижче 0, сигнальна лінія вийшла з тіла гістограми. RSI (14) в нейтральній зоні. IchimokuKinkoHyo (9,26,52) (сигнал – флет): лінія Tenkan-senніже лінії Kijun-sen, ціна в хмарі.
- Основна рекомендація: вхід на продаж від 1.4000, 1.4040, 1.4070.
- Альтернативна рекомендація: вхід на покупку від 1.3940, 1.3900, 1.3880.
Британський фунт залишається в бічному трикутнику на збереженні ризиків.
USD CHF (поточна ціна: 0.9370)

- Рівні підтримки: 0.9250 (мінімум серпня 2015 року), 0.9150, 0.9050 (мінімум травня 2015 року).
- Рівні опору :, 0.9550, 0.9800, 1.0030 (максимум листопада 2017 року).
- Комп’ютерний аналіз: MACD (12,26,9) (сигнал – спадний рух): індикатор вище 0, сигнальна лінія вийшла з тіла гістограми. RSI (14) в нейтральній зоні. IchimokuKinkoHyo (9,26,52) (сигнал – висхідний рух): лінія Tenkan-sen вище лінії Kijun-sen, ціна вище хмари.
- Основна рекомендація: вхід на продаж від 0.9390, 0.9420, 0.9440.
- Альтернативна рекомендація: вхід на покупку від 0.9350, 0.9330, 0.9300.
Швейцарський франк зберігає висхідну динаміку на невизначеності американця, але також уповільнив зростання на очікуванні даних по США.
USD JPY (поточна ціна: 107.00)
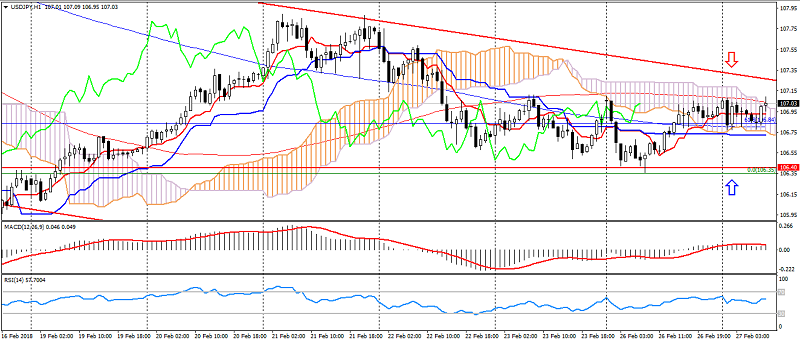
- Рівні підтримки: 106.40, 105.50, 104.50.
- Рівні опору: 108.00, 108.60, 110.00.
- Комп’ютерний аналіз: MACD (12, 26, 9) (сигнал – висхідний рух): індикатор вище 0, сигнальна лінія в тілі гістограмми.RSI (14) в нейтральній зоні. IchimokuKinkoHyo (9,26,52) (сигнал – висхідний рух): лінія Tenkan-sen вище лінії Kijun-sen, ціна вище хмари.
- Основна рекомендація: вхід на продаж від 107.20, 107.40, 107.70.
- Альтернативна рекомендація: вхід на покупку від 106.70, 106.50, 106.20.
Японська єна зберігає потенціал до зміцнення на низьку активність ринку і можливі ризики.
USD CAD (поточна ціна: 1.2690)

- Рівні підтримки: 1.2340,1.2200, 1.2060 (мінімум 2017 року).
- Рівні опору: 1.2500, 1.2650, 1.2770 (максимум серпня 2017 року).
- Комп’ютерний аналіз: MACD (12, 26, 9) (сигнал – висхідний рух): індикатор вище 0, сигнальна лінія в тілі гістограмми.RSI (14) в нейтральній зоні. IchimokuKinkoHyo (9,26,52) (сигнал – висхідний рух): лінія Tenkan-sen вище лінії Kijun-sen, ціна вище хмари.
- Основна рекомендація: вхід на продаж від 1.2710, 1.2750, 1.2770.
- Альтернативна рекомендація: вхід на покупку від 1.2660, 1.2630, 1.2610.
Канадський долар зберігає флет на невизначеності ринку.
AUD USD (поточна ціна: 0.7840)
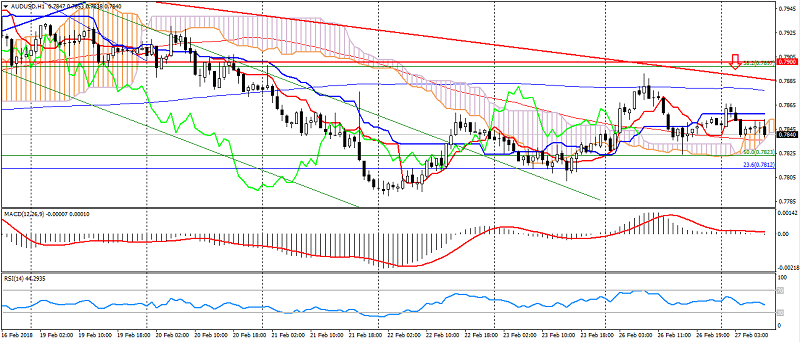
- Рівні підтримки: 0.7900, 0.7700 (максимум березня 2017 року), 0.7500.
- Рівні опору: 0.8120 (максимум 2017 року), 0.8200, 0.8290 (максимум 2014 року).
- Комп’ютерний аналіз: MACD (12, 26, 9) (сигнал – флет): індикатор біля 0. RSI (14) в нейтральній зоні. IchimokuKinkoHyo (9,26,52) (сигнал – висхідний рух): лінія Tenkan-sen вище лінії Kijun-sen, ціна вище хмари.
- Основна рекомендація: вхід на продаж від 0.7870, 0.7900, 0.7930.
- Альтернативна рекомендація: вхід на покупку від 0.7830, 0.7800, 0.7780.
Австралієць зберігає потенціал до зниження на можливі ризики.
NZD USD (поточна ціна: 0.7280)
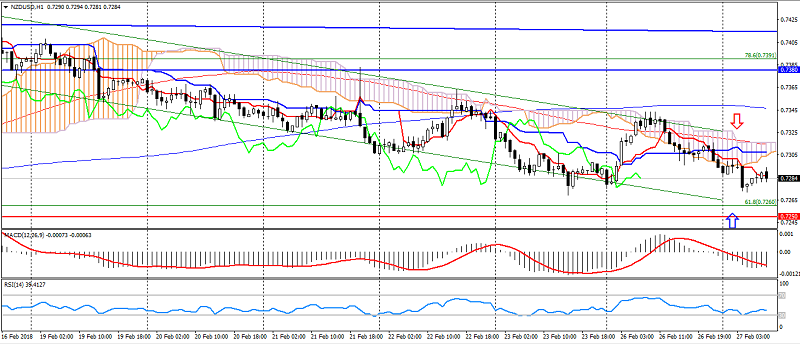
- Рівні підтримки: 0.7250, 0.7130 (мінімум серпня 2017 року), 0.7000.
- Рівні опору: 0.7380, 0.7450, 0.7550 (максимум 2017 року).
- Комп’ютерний аналіз: MACD (12, 26, 9) (сигнал – спадний рух): індикатор нижче 0, сигнальна лінія в тілі гістограми. RSI (14) в нейтральній зоні. IchimokuKinkoHyo (9,26,52) (сигнал – спадний рух): лінія Tenkan-sen нижче лінії Kijun-sen, ціна нижче хмари.
- Основна рекомендація: вхід на продаж від 0.7320, 0.7340, 0.7370.
- Альтернативна рекомендація: вхід на покупку від 0.7260, 0.7240, 0.7220.
Новозеландський долар залишається під тиском через втечу інвесторів від ризиків.
XAU USD (поточна ціна: 1333.00)

- Рівні підтримки: 1320.00, 1303.00, 1280.00.
- Рівні опору: 1355.00 (максимум травня 2016 року), 1374.00, 1290.00 (максимум березня 2016 року).
- Комп’ютерний аналіз: MACD (12, 26, 9) (сигнал – флет): індикатор біля 0. RSI (14) в нейтральній зоні. IchimokuKinkoHyo (9,26,52) (сигнал – висхідний рух): лінія Tenkan-sen вище лінії Kijun-sen, ціна вище хмари.
- Основна рекомендація: вхід на продаж від 1342.00, 1345.00, 1349.00.
- Альтернативна рекомендація: вхід на покупку від 1328.00, 1324.00, 1320.00.
Золото зберігає зростання через ризики, але при цьому обмежується майбутніми новинами по США.